

Task run summary
Building a comprehensive content for you: A Work in Progress...
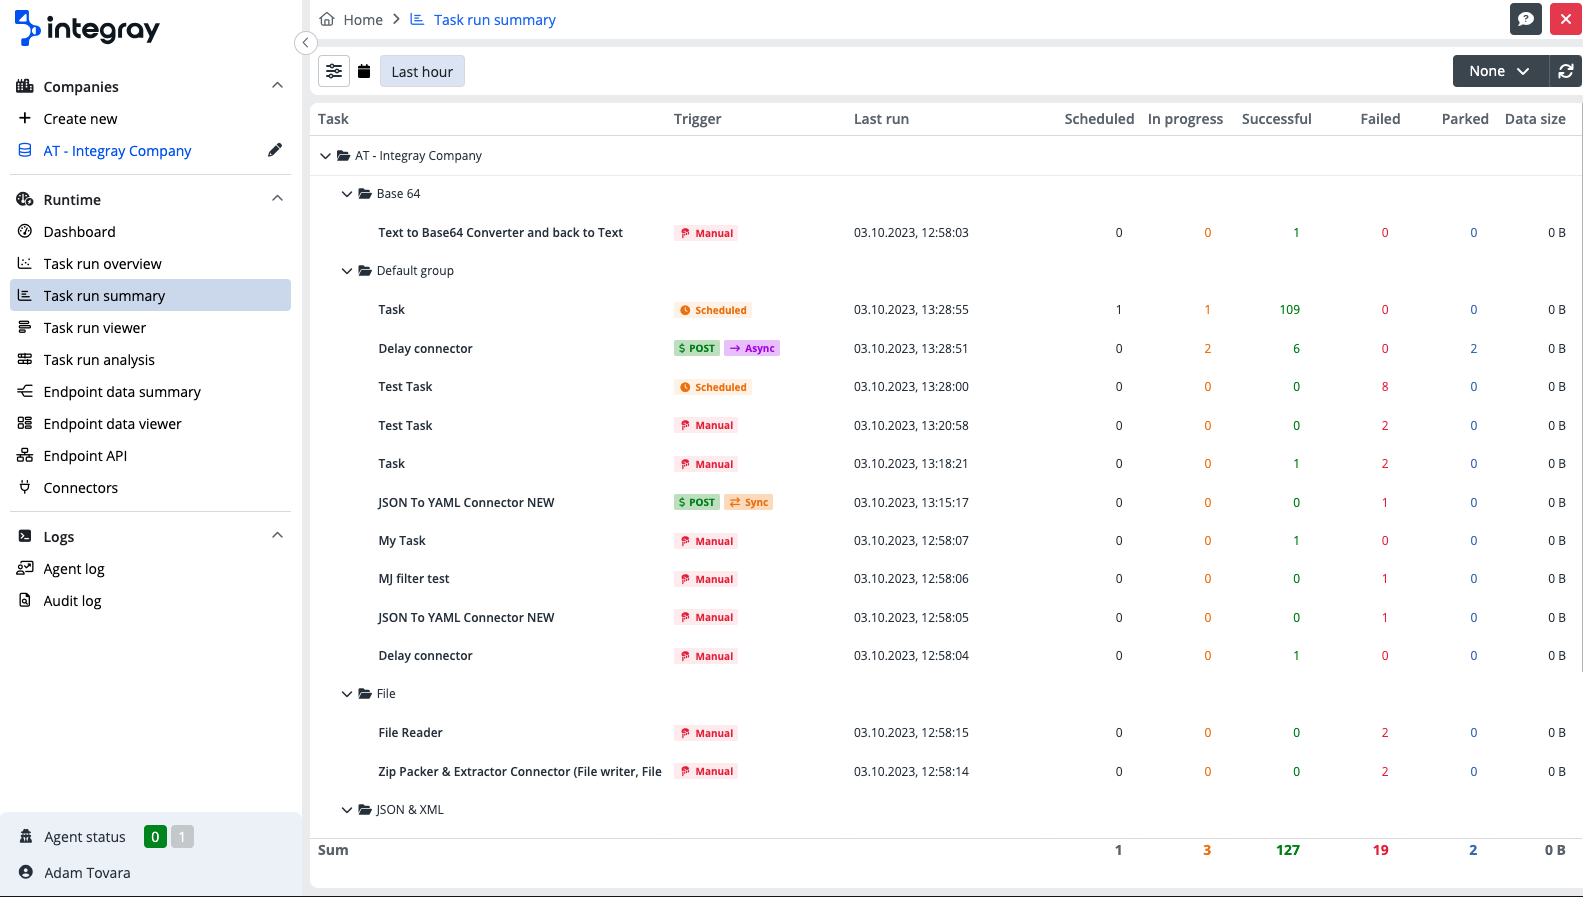
The task run summary is a view providing the user with an overview of the aggregated counts for the task runs.
flowchart TD
  A[Endpoint data summary] --> B[Endpoint data viewer]
  B --> C[Task runs]
  B --> D[Data viewer]
  C --> E[Task history view + Log]
  G[Dashboard] --> E
  E --> F[Task step data snapshot]
  H[<b>Task run summary</b>]:::someclass --> I[Task run viewer]
  I --> E
  J[Task run analysis] -- Filter: Outliners only --> I
  K[Home screen Task run search] --> E
  classDef someclass fill:#ebf5eb
Result view
The result view is structured into a tabular format including columns: Task, Trigger, Last run and the counts of task runs in individual statuses: Scheduled, In progress, Successful, Failed, Parked and Data size.
-
Task - Column task is organized in a structured way displaying Company --> Task group --> Tasks.
-
Trigger - Displays the trigger for the respective task: Manual, Scheduled, GET, POST. More about the task triggers can be found in the Help center > Configuration > Tasks. If the task is triggered by an endpoint, additional information will be displayed in the Trigger column about the task run start: Method (POST / GET), Start task Synchronously or Asynchronously (Sync / Async) and the Endpoint name.
-
Last run - Date and time of the last task run.
Counts of task runs in individual statuses:
-
Scheduled - Count of the task runs scheduled for future runs.
-
In progress - Count of the task runs currently in progress.
-
Successful - Count of the finished task runs.
-
Failed - Count of the failed task runs.
-
Parked - Count of the parked task runs.
All of the above count results in the summary are active and clickable. Clicking on the numbers navigates you to the Task run viewer with the applied filter on respective task group, task, and status.
- Data size - If any data is produced, the size of the data is displayed. This feature is by default switched off. Use the built-in filters to show the Data size.
Filters
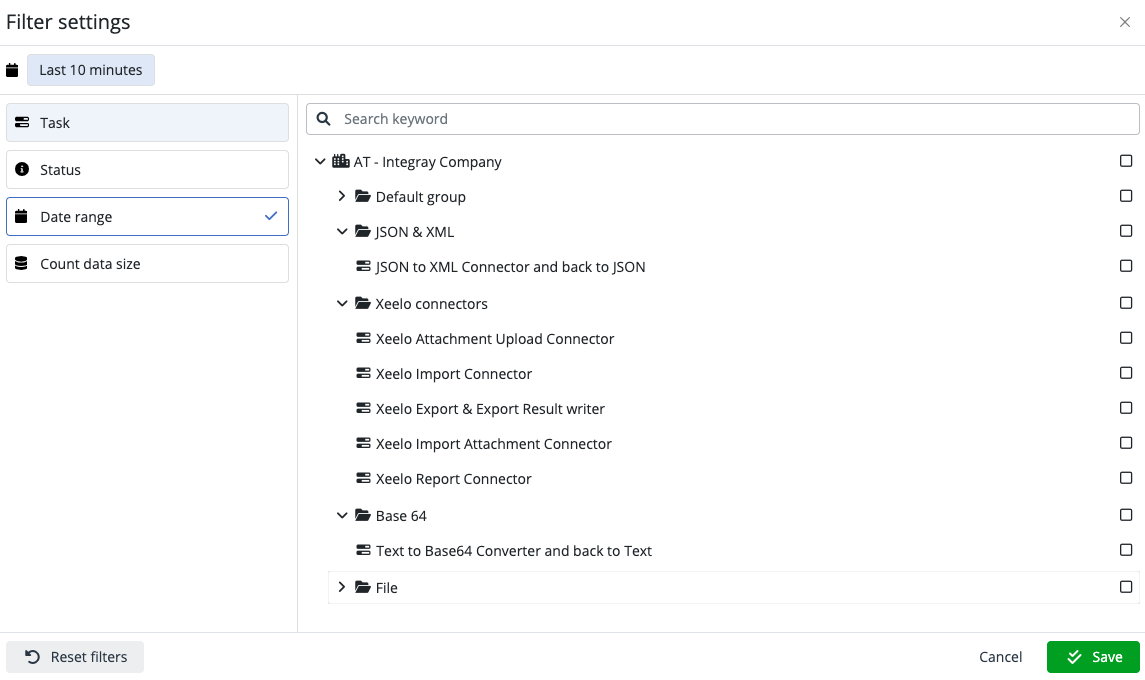
The task run summary view includes built-in filters to narrow down the result data set. Every filter has multiple value selection feature available. If more values are selected within one filter, logical operator OR applies among the selected values.
The visibility of the values to select in the filters are driven by the user access rights. The administrators can see any company, task group, and task in the filters. The standard users can only see the values related to the companies they own or have access to. E.g. the company owner, can filter on the tasks realted to the owned company.
You can enter the built-in filters by clicking the button on the left side and opening the modal dialog window.

Built-in filters
-
Task - This filters a single or more tasks, or filters the tasks of the entire company, or those of the task group.
-
Status - Select the required status. See below the status table.
ID Status description ID Status description 0 Unknown 301 Failed agent killed 1 Scheduled 302 Failed timeout 100 In progress 303 Failed cancelled by user 101 Waiting for agent 304 Failed run time 200 Finished success 305 Failed agent 201 Finished no data 306 Failed output 202 Finished with errors 307 Failed input 203 Nothing to process 999 Parked 300 Failed connector Generally, statuses 1xx - represent "in progress", 2xx - represent "finished", 3xx - represent "failed".
-
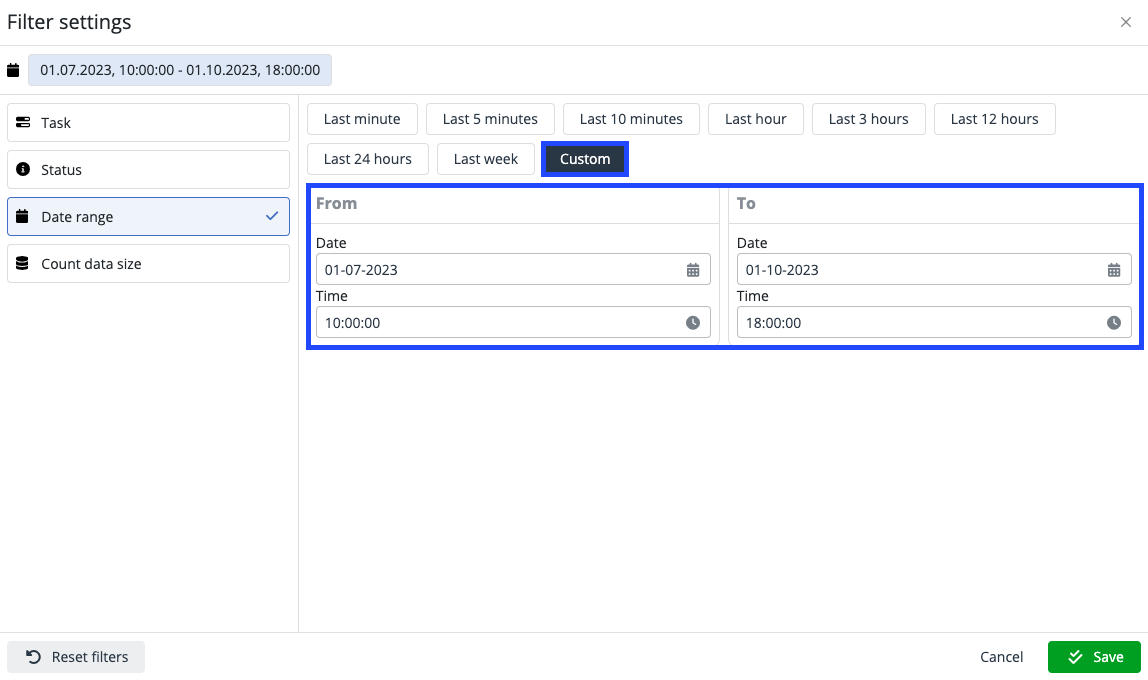
Data range - Select the required data range from the Predefined ranges
Last minute,Last 5 minutes,Last 10 minutes,Last hour,Last 3 hours,Last 12 hours,Last 24 hours,Last week. Additionally, a custom date range can be set - From:Date&Time, To:Date&Time.
- Count data size - Enables you to show or hide the size of the incoming data. This feature is "expensive" from a performance perspective and is by default switched off (Hide)
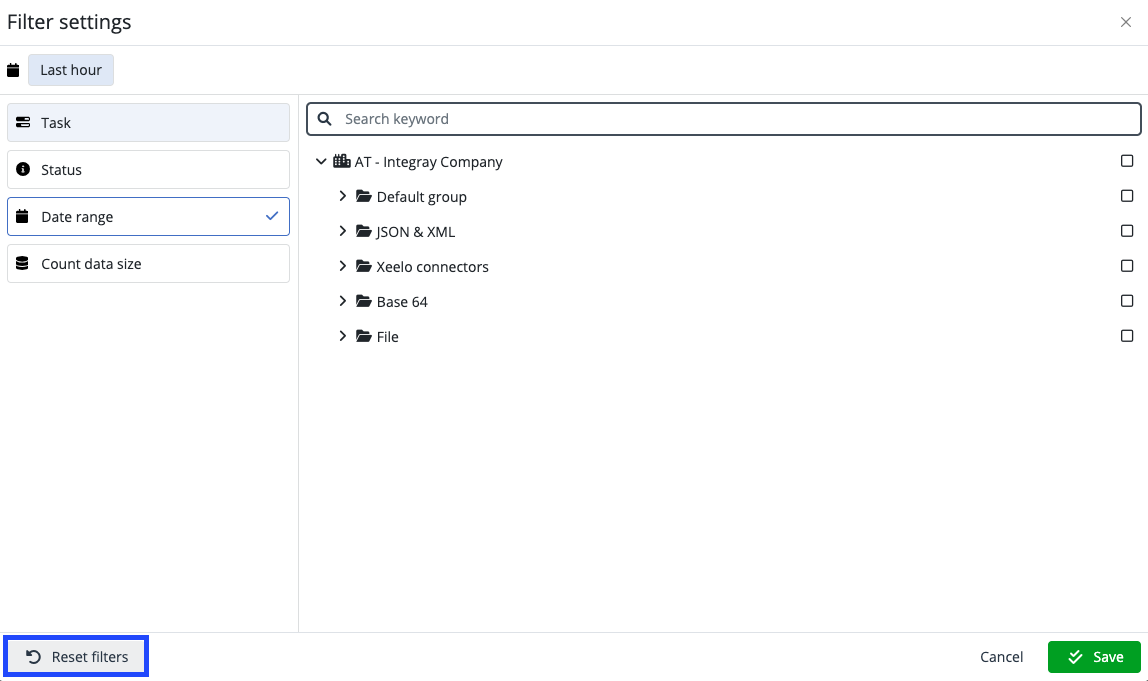
You can reset all the filters by clicking the Reset filters button in the left bottom corner of the Filter settings. The filter will be set to the default values.
Number of displayed tasks
The task run summary can display up to 100 tasks. If the number of tasks to be displayed is greater than 100, you will be prompted by the system and asked to use the built-in filters to limit the set of displayed tasks.