Endpoint data viewer
The Endpoint data viewer is a view providing the user with an overview of data processed on the configured, active endpoints. The user can access the endpoint data viewer by using the menu item Endpoint data viewer in the Home screen content navigation menu. The alternative way is to access the endpoint data summary and drill-down by clicking the count number for the endpoint.
See the report structure and the drill down paths to explore the data details.
flowchart TD
  A[Endpoint data summary] --> B[<b>Endpoint data viewer</b>]:::someclass
  B --> C[Task runs]
  B --> D[Data viewer]
  C --> E[Task history view + Log]
  G[Dashboard] --> E
  E --> F[Task step data snapshot]
  H[Task run summary] --> I[Task run viewer]
  I --> E
  J[Task run analysis] -- Filter: Outliners only --> I
  K[Home screen Task run search] --> E
  classDef someclass fill:#ebf5eb
Endpoint data viewer filter menu
The endpoint data viewer filter menu and preview contains the filter button on the very left of the menu, which opens the modal dialog window for the Filter settings as well as buttons related to the active, applied filters.

Endpoint data viewer grid
Data are displayed in a tabular/grid format with the following columns:
-
Endpoint - This provides information about the name of the endpoint and the used method.
-
Source IP - The IP address from where the endpoint call
-
Token - Indication of the token use. If the primary token is used, the indication on the gird is
Primaryand if the secondary token is used, the indication on the gird is thesecondary token name.
Info
It is a good practice to create, assign, and use secondary tokens instead of the primary tokens.
-
Received date - The information on the date and time when the call has been received.
-
Pending time - The information on the time how long the data were waiting for the processing. It is the difference between the received time and the time when the orchestrator started to process the data. If the times are too high, it may indicate wrong setup of the task (max instances) or you have an insufficient license for the most optimal processing of your integration data flows. It also may be dependent on configured priority.
-
Duration - Processing time, the difference between the real data processing start and finish time.
-
Status - This displays the endpoint data processing status.
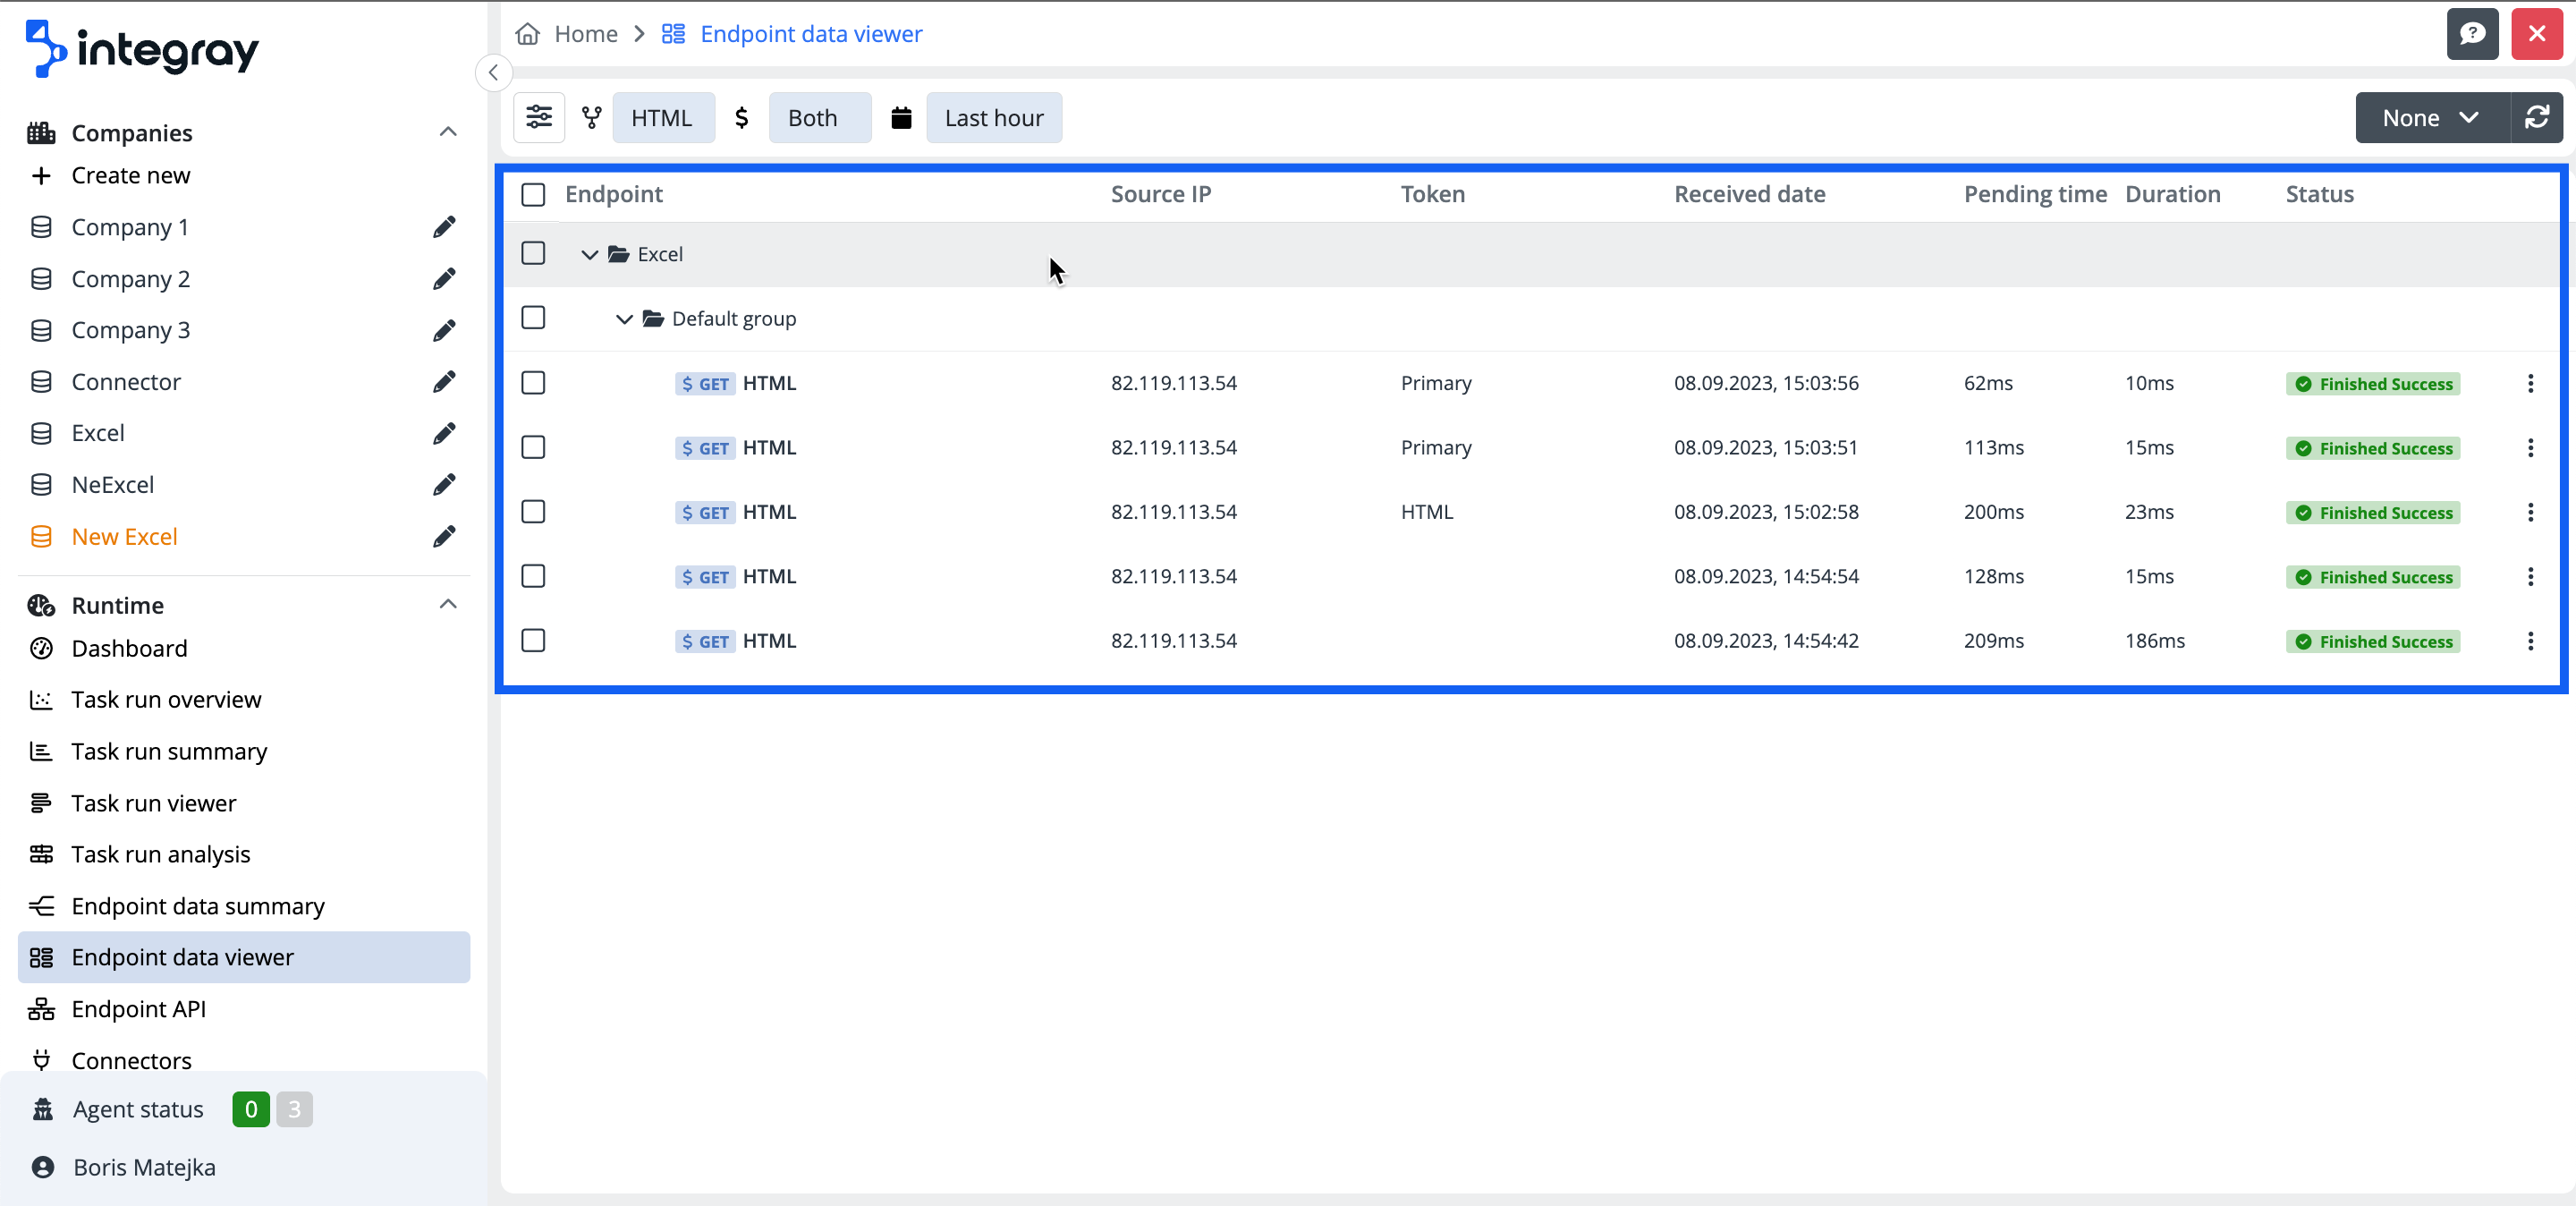
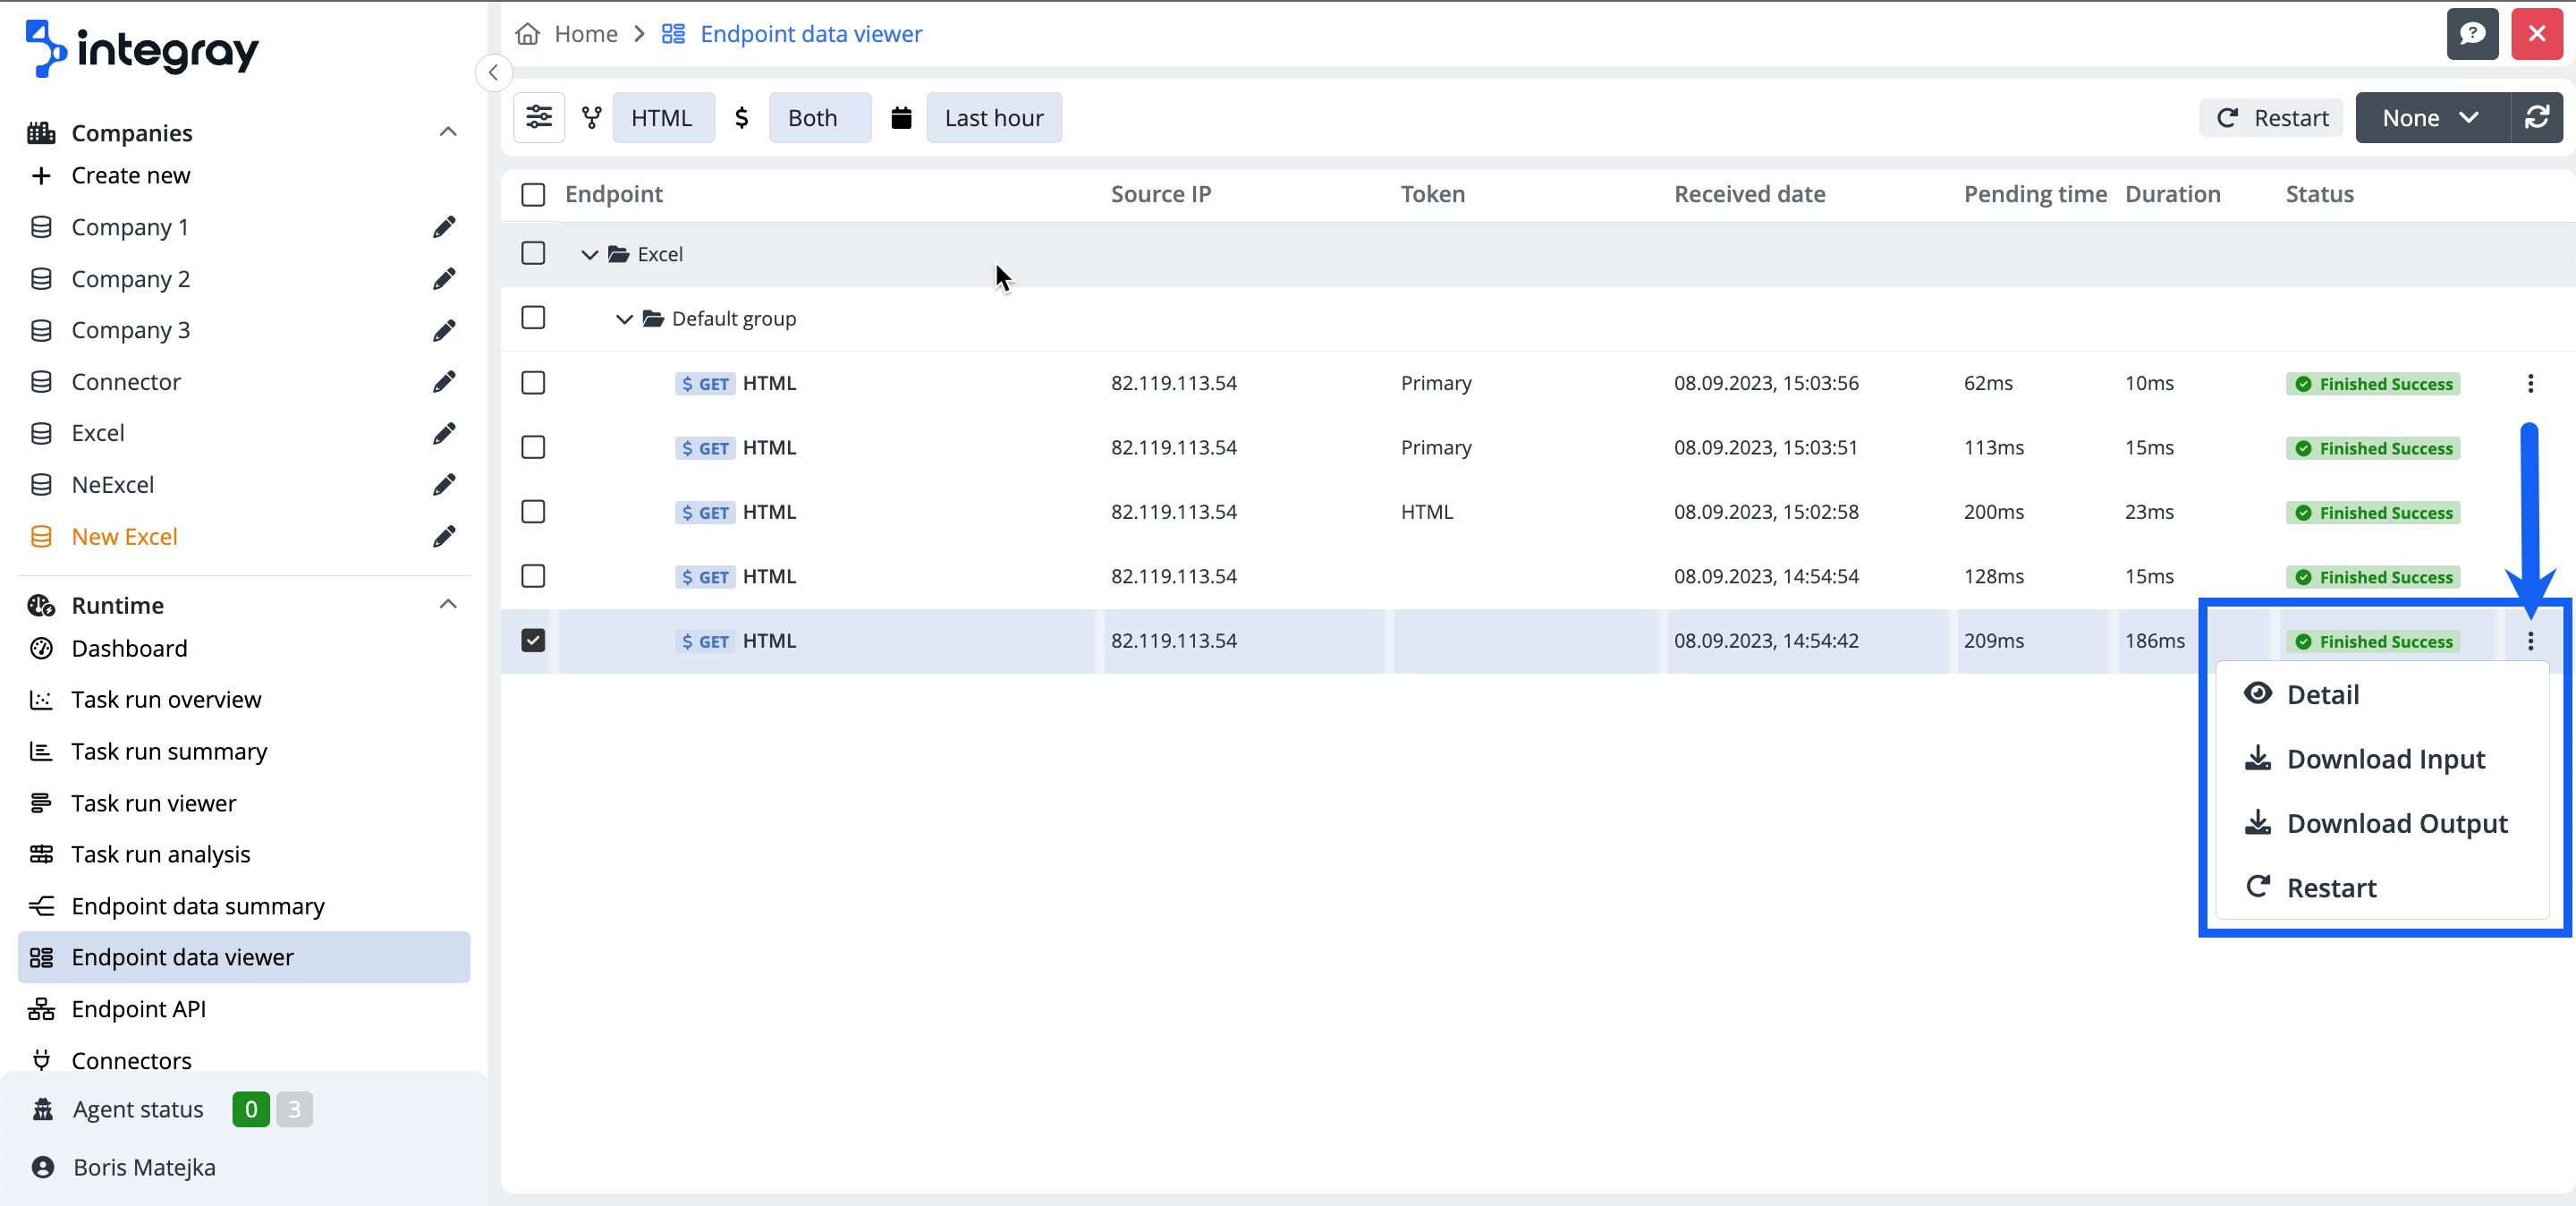
The displayed records are grouped by the company and the endpoint groups. Every endpoint record line includes on the right end the ellipses with a context menu offering additional actions related to a single endpoint record and the status of the task run:
-
Detail - This shows the details of the selected endpoint data.
-
Download input - This downloads the input data if available.
-
Download output - This downloads the output data if configured to be saved and if available.
-
Restart - This restarts the task run of the task bound to the selected endpoint with the task run status Finished or Failed. You will be prompted in the modal dialog window to confirm the restart of the task run.
-
Cancel - This cancels the task run of the task bound to the selected endpoint with task run status In Progress. You will be prompted in the modal dialog window to confirm the cancellation of the task run.
-
Park - This park the task run of the task bound to the selected endpoint with task run status Scheduled. You will be prompted in the modal dialog window to confirm the park of the task run.
-
Unpark - This unpark the task run of the task bound to the selected endpoint with task run status Parked. You will be prompted in the modal dialog window to confirm the unpark of the task run.
The Endpoint data viewer can be automatically refreshed at a set frequency of 10 sec, 30 sec, 60 sec, or 5 min. If the frequency is set to None, data refresh must be executed manually.
Multi-select and Autorefresh
Multiple endpoints can only be selected when autorefresh is set to None. However, multi-select is not possible if autorefresh is active, meaning the page refreshes after a set time ( 10 sec, 30 sec, etc.).
If you check one or more endpoints with the same status (Finished, Failed, In progress, or Parked) in the left part of the viewer, an action button (Cancel, Restart, or Unpark) will appear in the upper right part of the screen, which can trigger an action for the checked endpoints. So you can quickly work with a group of checked endpoints.
If endpoints with different statuses are checked, you will be informed that rows with the same status must be selected.

Filter settings
The data set in the Endpoint data viewer can be narrowed down to the required result by using the built-in filters.
You can enter the built-in filters by clicking the sliders button on the left side of the endpoint data viewer filter menu and opening the modal dialog window Filter settings.
Built-in filters
-
Endpoint - This filters a single or more endpoints, or filters the endpoint of the entire company, or those of the endpoint group.
-
Tokens - This filters endpoints based on used tokens.
-
Method - This filters endpoints based on the used method.
-
Status - This filters endpoints based on the processing status.
-
Date range - This filters endpoints based on the received dates, using either predefined periods or custom ones.
-
Endpoint data ID - This filters endpoints based on the Endpoint data ID.
-
Source IP - This filters endpoints based on the Source IP.
-
Data filter - This filters endpoints data based on the indexed data points, configured on the endpoint. Please read the endpoint documentation to learn more about the data indexing.

Usage of the filters:
Choose the required type of filter on the left side and configure it on the right side. Used filters are marked with an active marker icon on the left side, as well as those are visible as buttons on the filter menu and preview. To cancel the active filter, click the cross icon on the right side of the button. If the button does not contain a cross to remove the filter, it means the filter is default and can't be removed. You can reset all the filters by clicking the Reset filters button in the left bottom corner of the Filter settings.
Warning
The endpoint data viewer can display up to 100 endpoint data requests. If the number of endpoint data requests to be displayed is greater than 100, you will be prompted by the system and asked to use the built-in filters to limit the set of displayed endpoint data requests.
Clicking on the single endpoint data record navigates the user to view related task runs and data view.
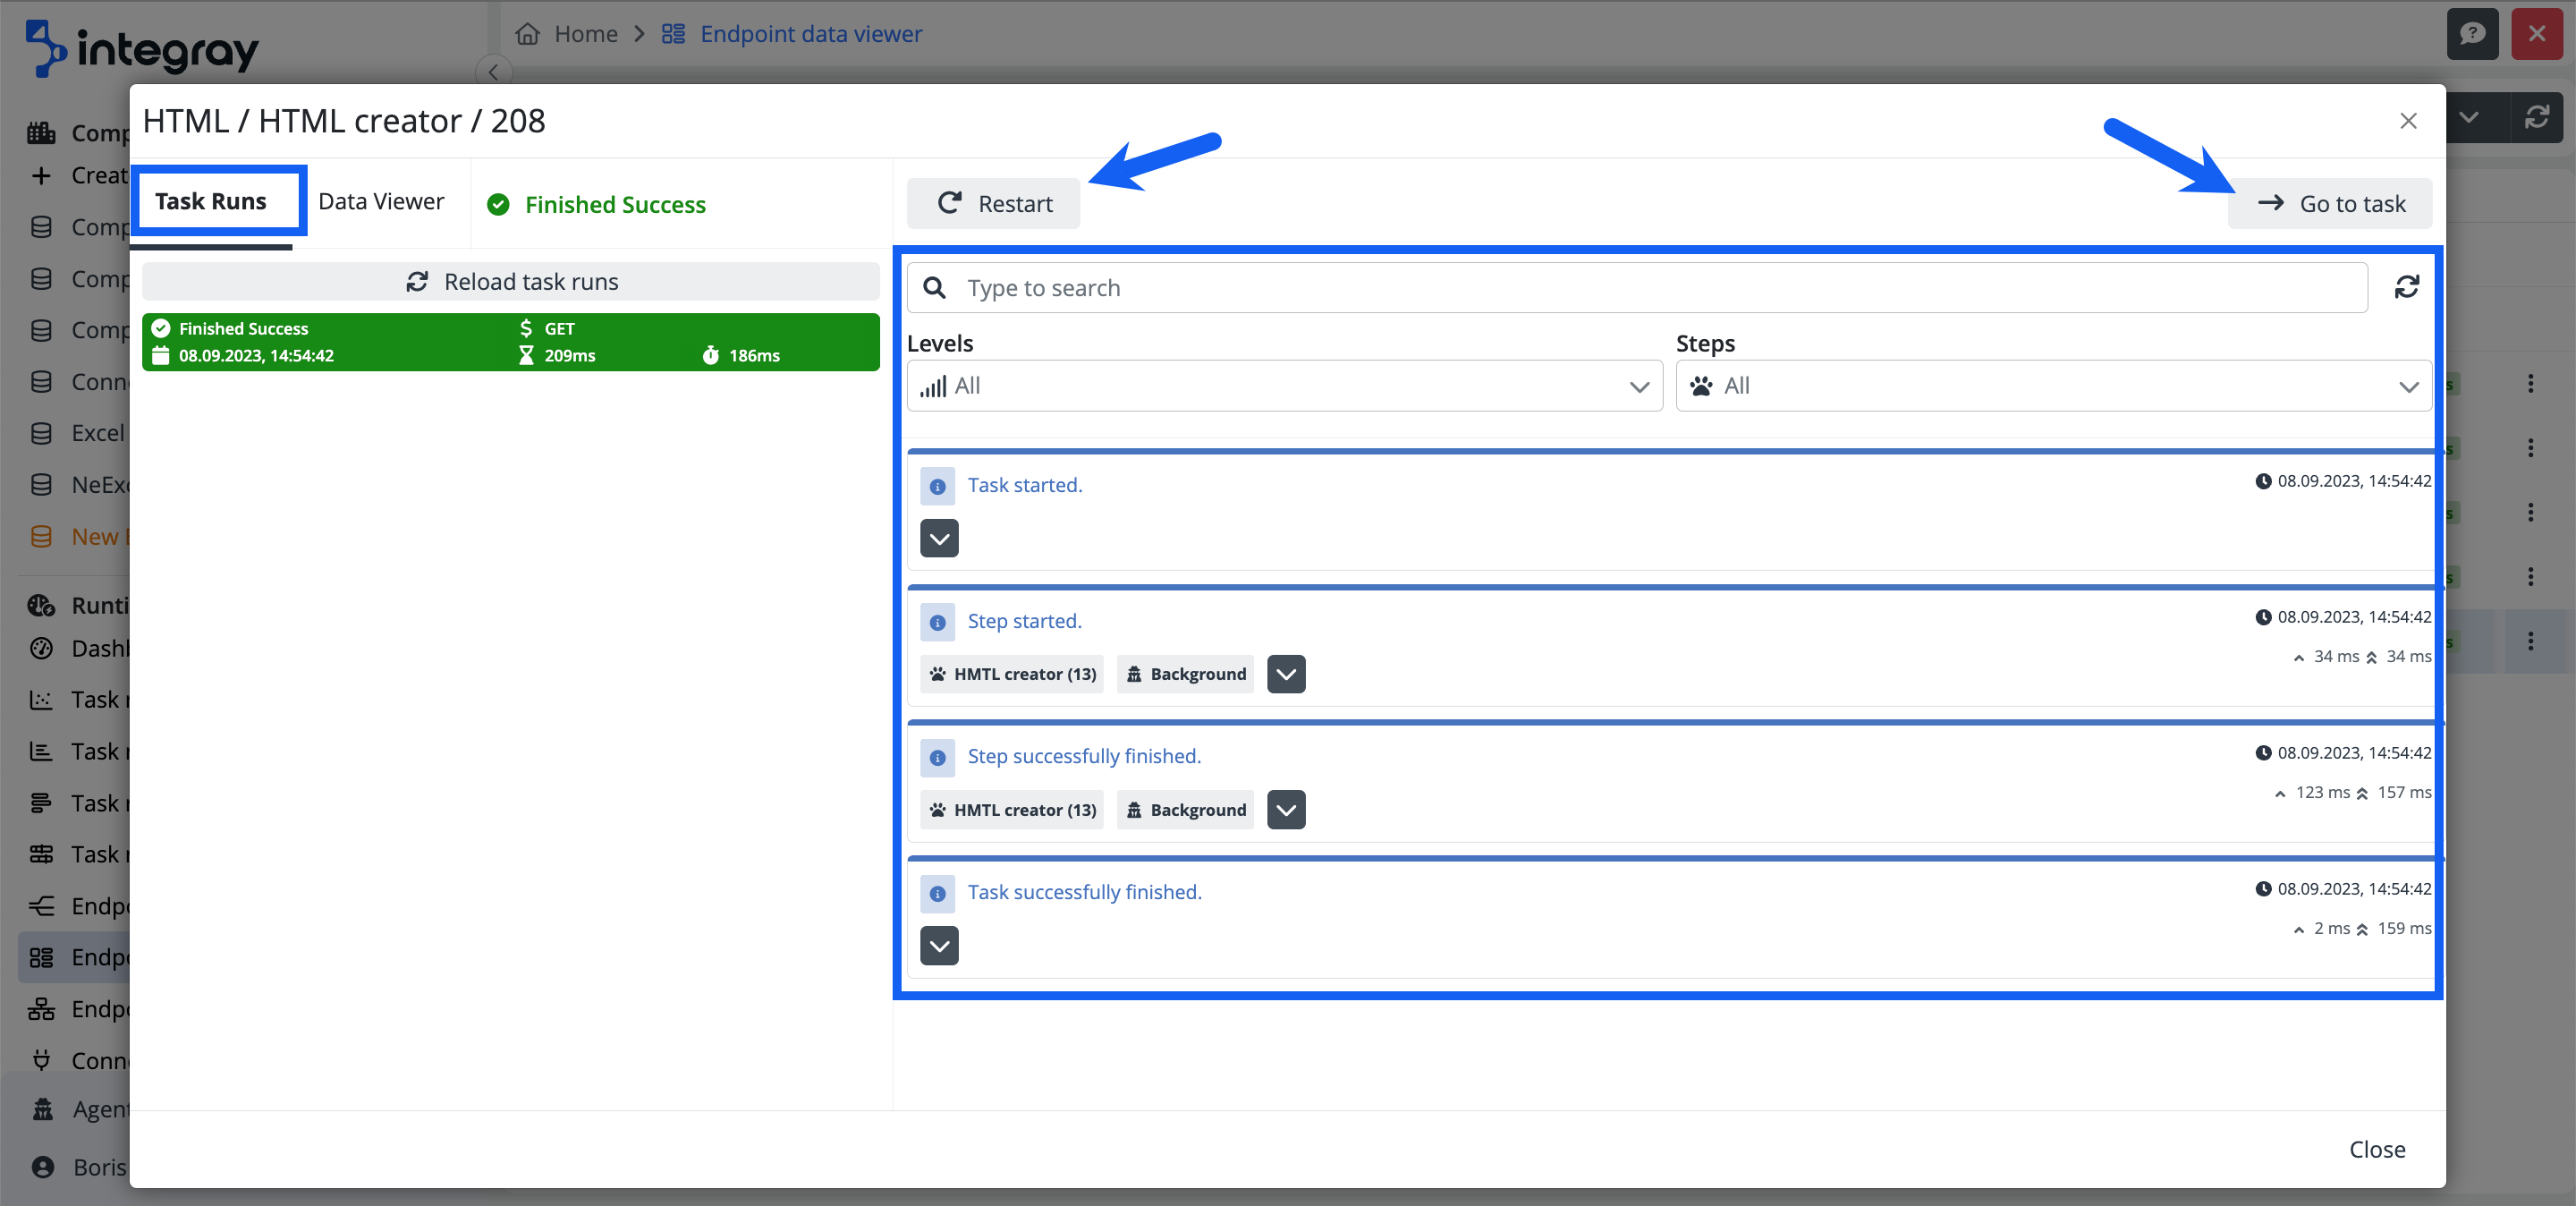
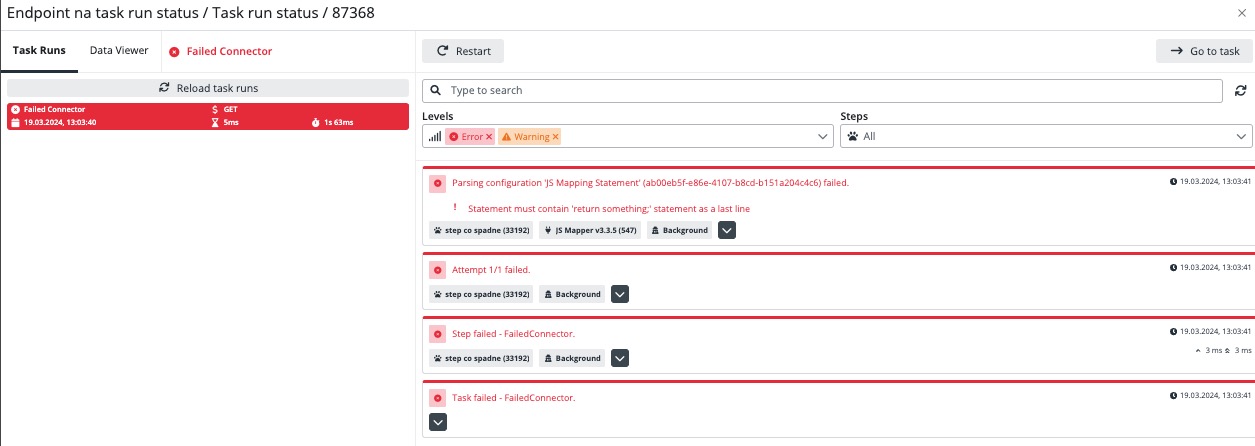
Task Runs
In the Task Runs tab, additional actions are available based on the outcome of the run:
- Finish Success
RestartandGo to taskbuttons. This view also includes data from the task run log and files Level and Steps, as well as full-text search.
- Failed The task run has concluded unsuccessfully. You can restart it by clicking
Restart, and there is also theGo to taskbutton available. This view also includes data from the task run log and files Level and Steps, as well as full-text search.
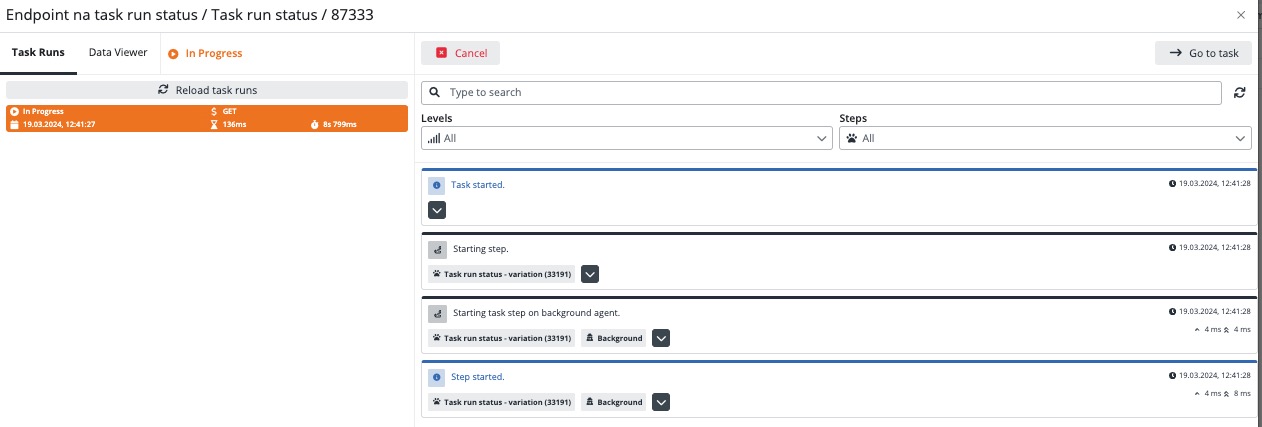
- In Progress
CancelandGo to taskbuttons. This view also includes data from the task run log and files Level and Steps, as well as full-text search.
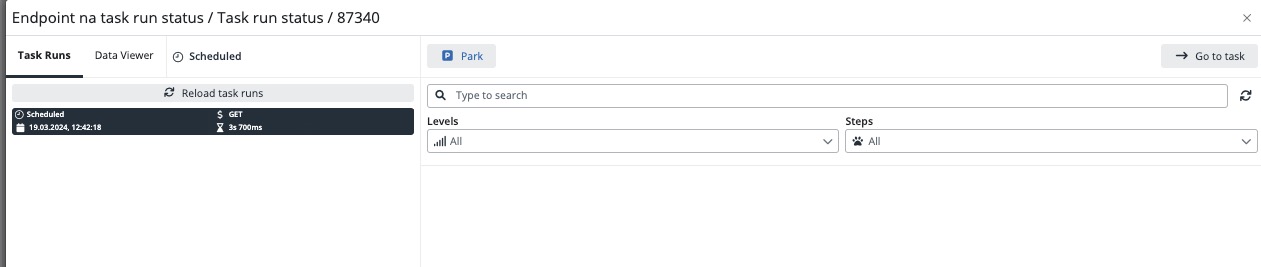
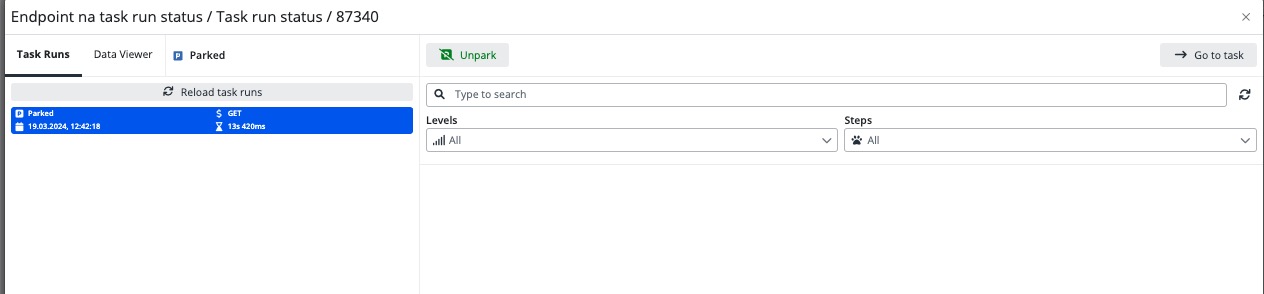
- Scheduled The task run is planned. You can pause this run by clicking
Parkand resume it later by clickingUnpark. In both cases, there is also theGo to taskbutton.
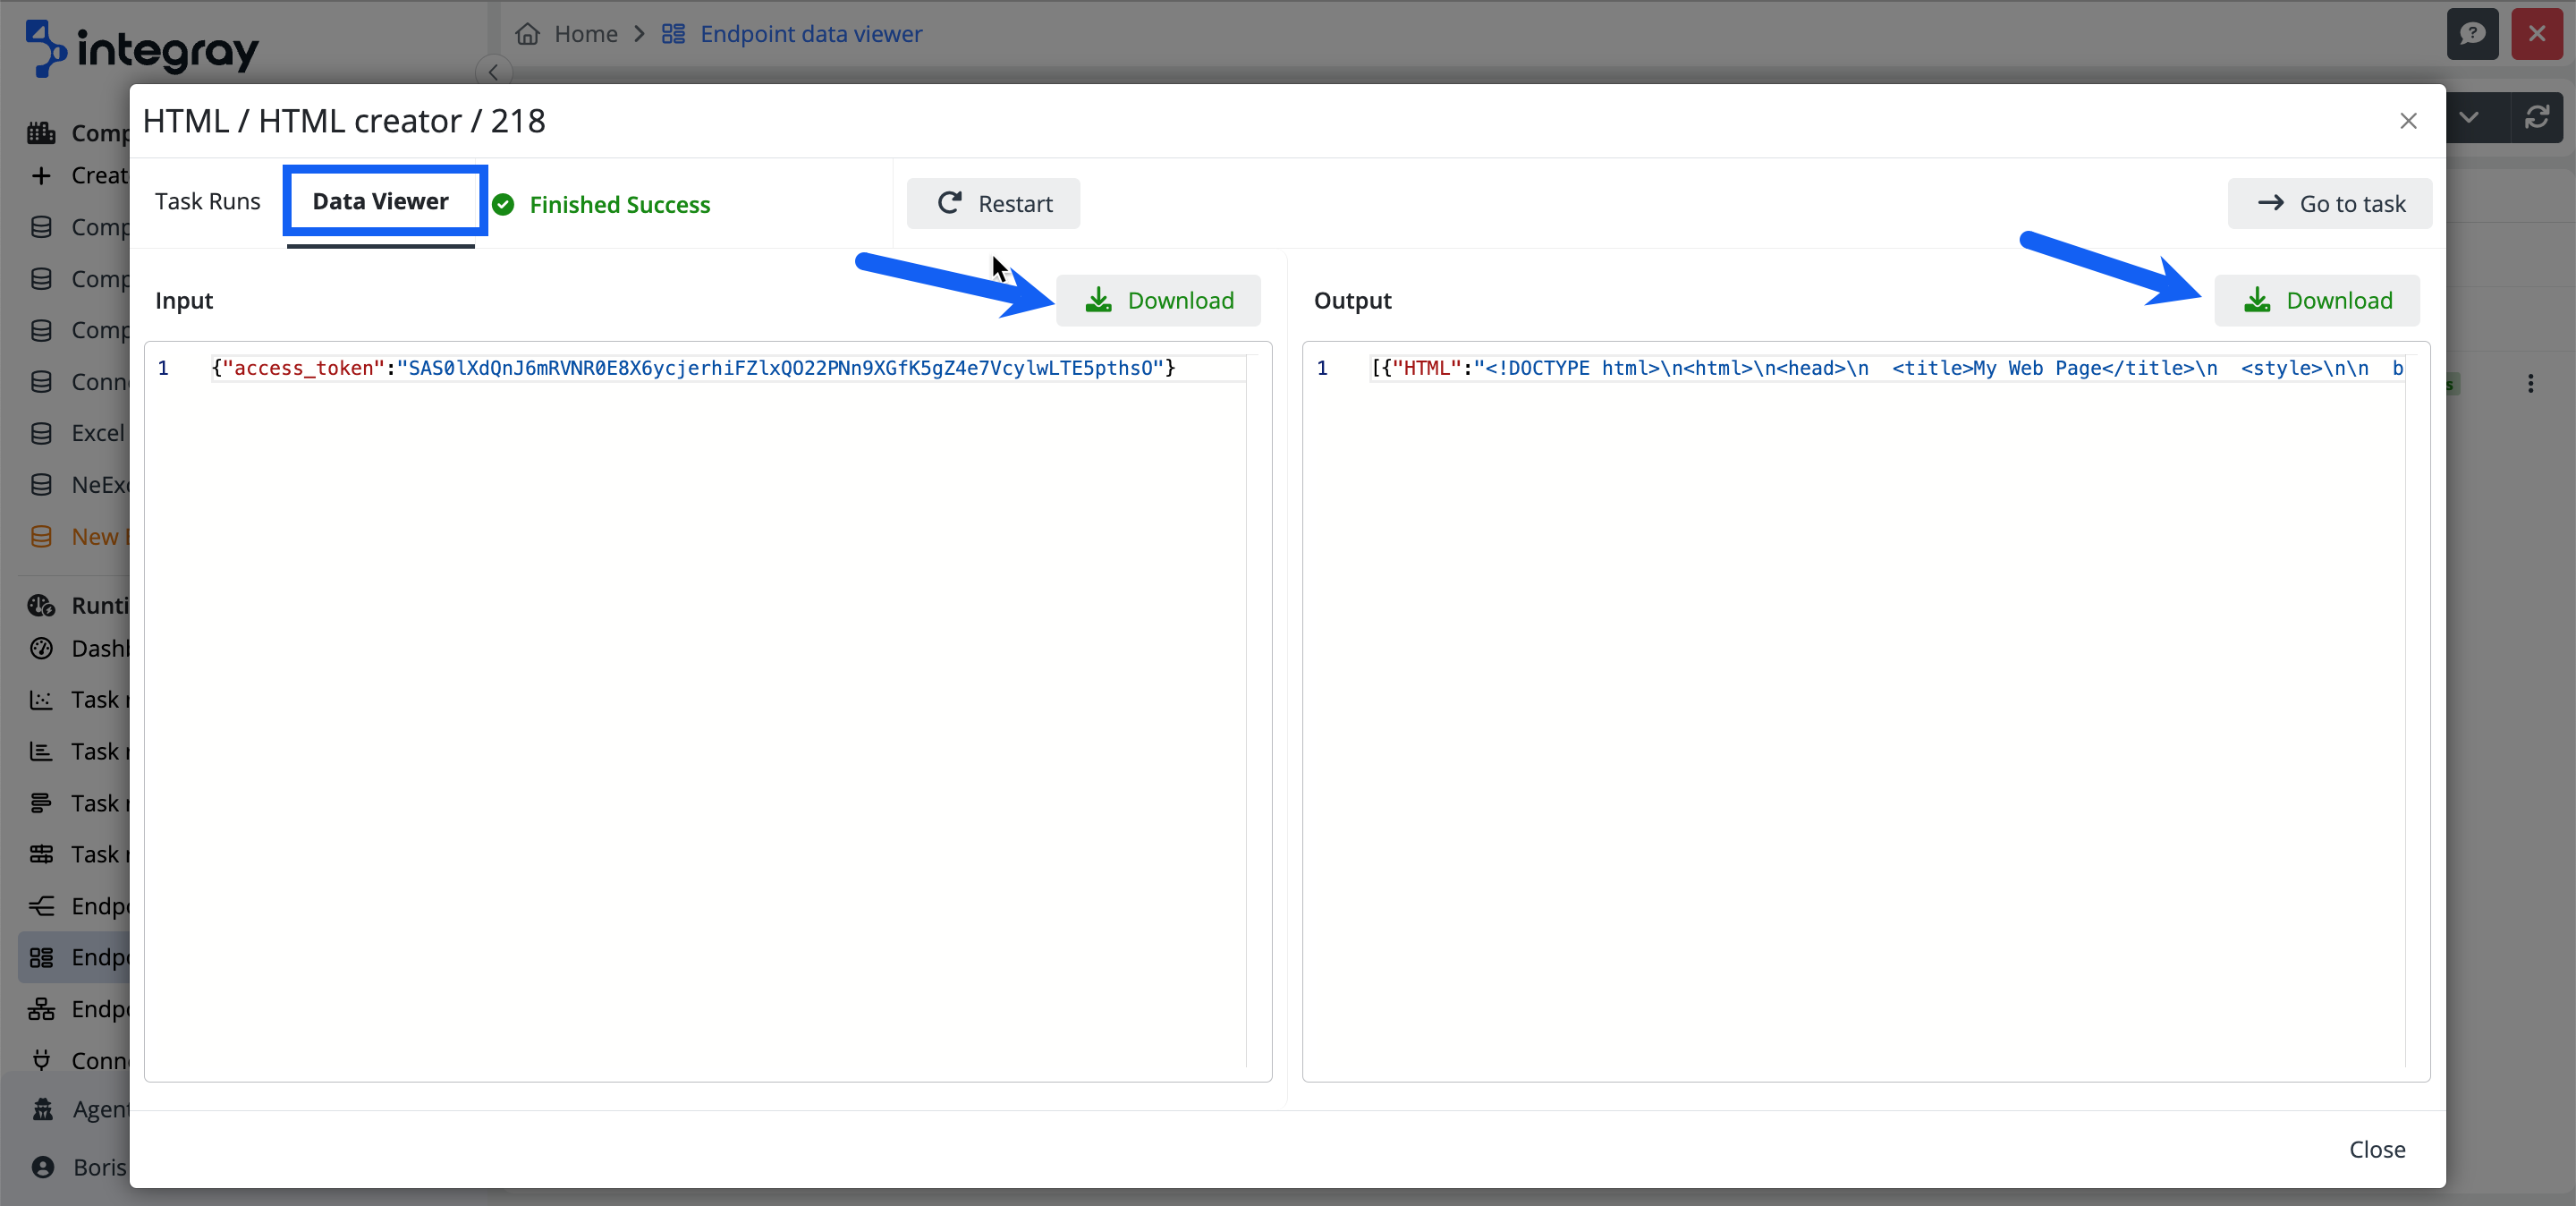
Data Viewer
In the Data Viewer tab, you can download the input data or download the output data if saved and available.