

Dashboard
Building a comprehensive content for you: A Work in Progress...
Dashboard provides the user with details on the status of the Task runs.
flowchart TD
  A[Endpoint data summary] --> B[Endpoint data viewer]
  B --> C[Task runs]
  B --> D[Data viewer]
  C --> E[Task history view + Log]
  G[<b>Dashboard</b>]:::someclass --> E
  E --> F[Task step data snapshot]
  H[Task run summary] --> I[Task run viewer]
  I --> E
  J[Task run analysis] -- Filter: Outliners only --> I
  classDef someclass fill:#ebf5eb
The dashboard displays 4 types of task run execution statuses:
-
Scheduled task runs - not performed yet; scheduled by scheduler; task trigger value set to Scheduled
-
Currently running task runs
-
Successfully completed task runs
-
Failed task runs
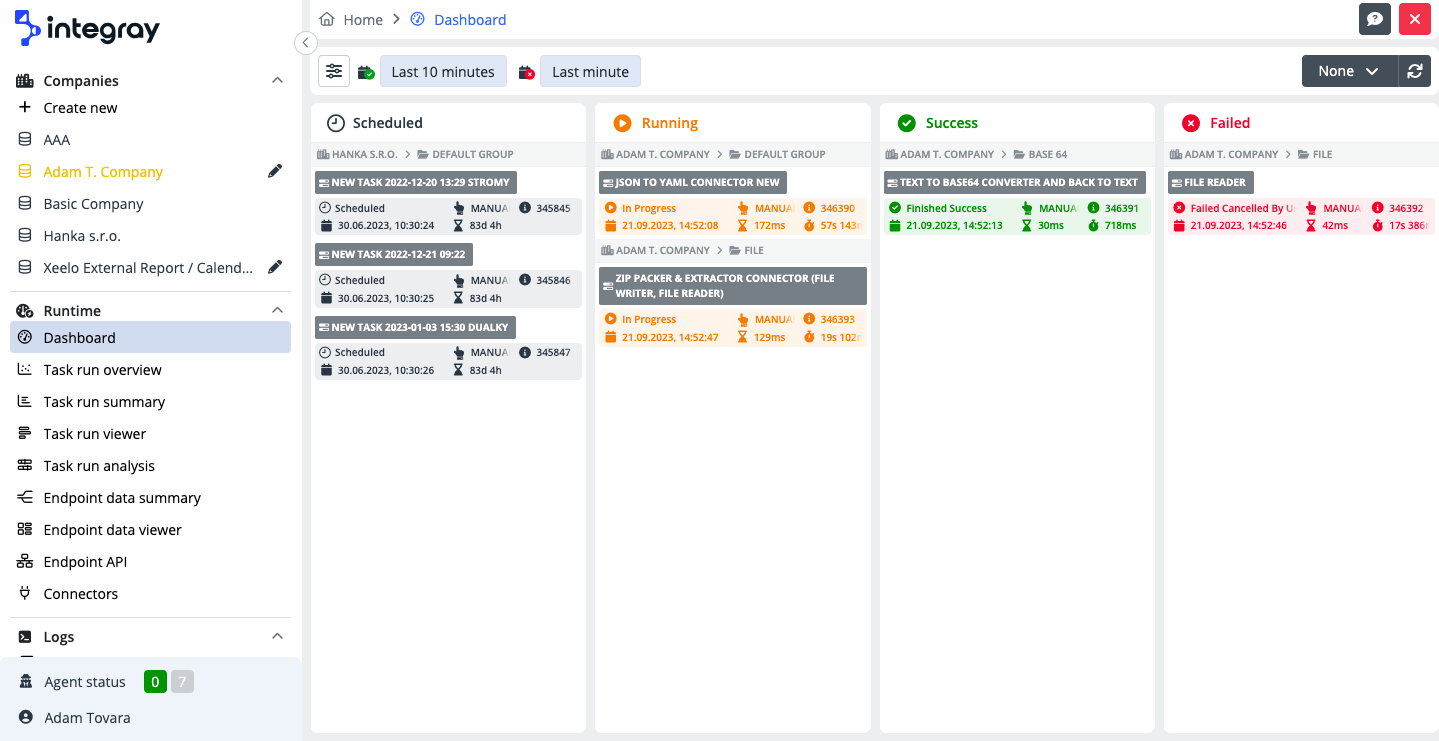
The dashboard can be refreshed automatically with a set refresh frequency of 10 sec, 30 sec, 60 sec, 5 min. In case the frequency is set to "None", data refresh has to be executed manually.

Click the single task on the dashboard to enter the task and see the detail of the selected task run. The detail of the selected task run provides information on Scheduled time, Started time, Finished time, Trigger, Wait time, Execution time, Task run ID, Execution status and the Log

See Help center > Configuration screen > Task for more details.
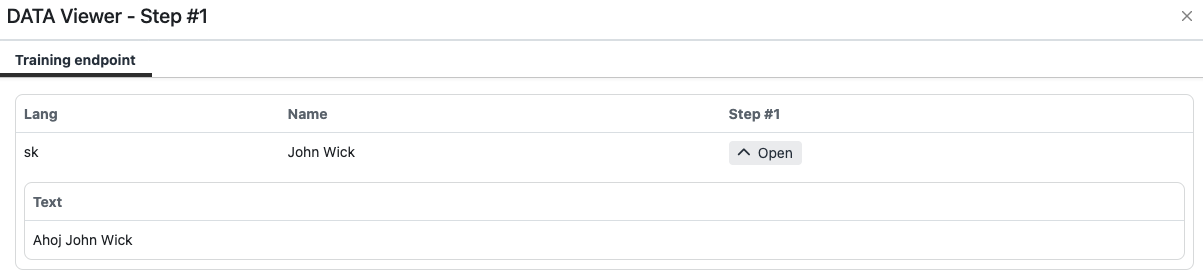
In case the task step has the data snapshots setting turned on everytime, the user can additionally have a view on the data of the processed step . Click the database icon and view the data detail.
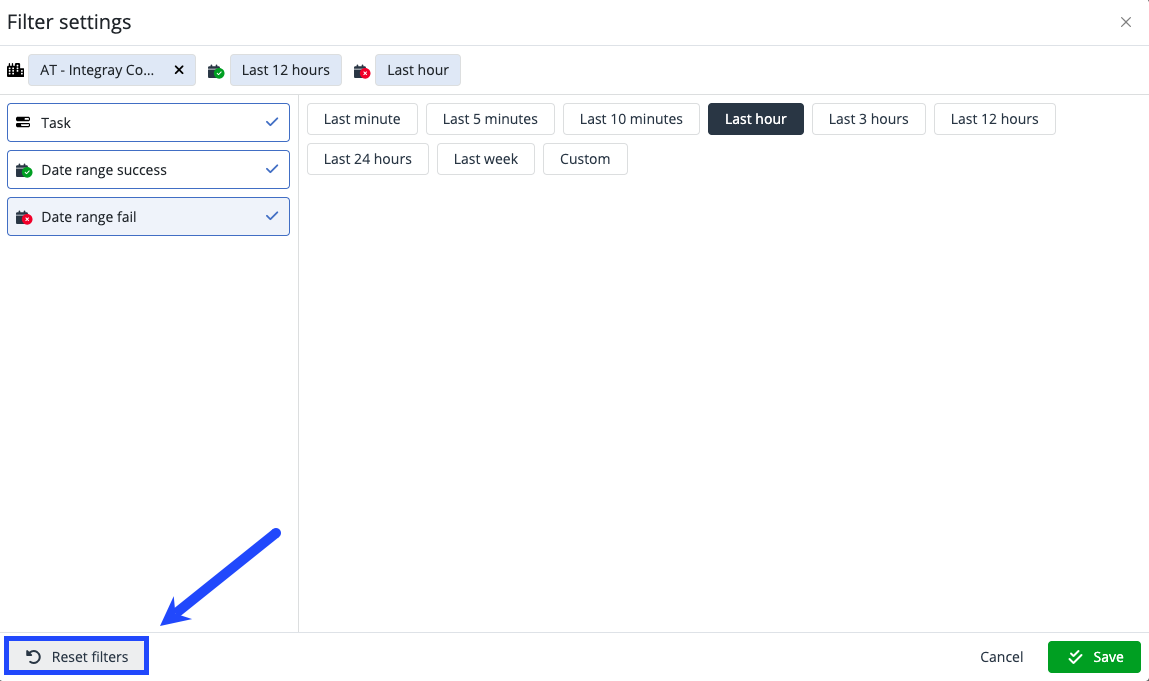
Filter settings
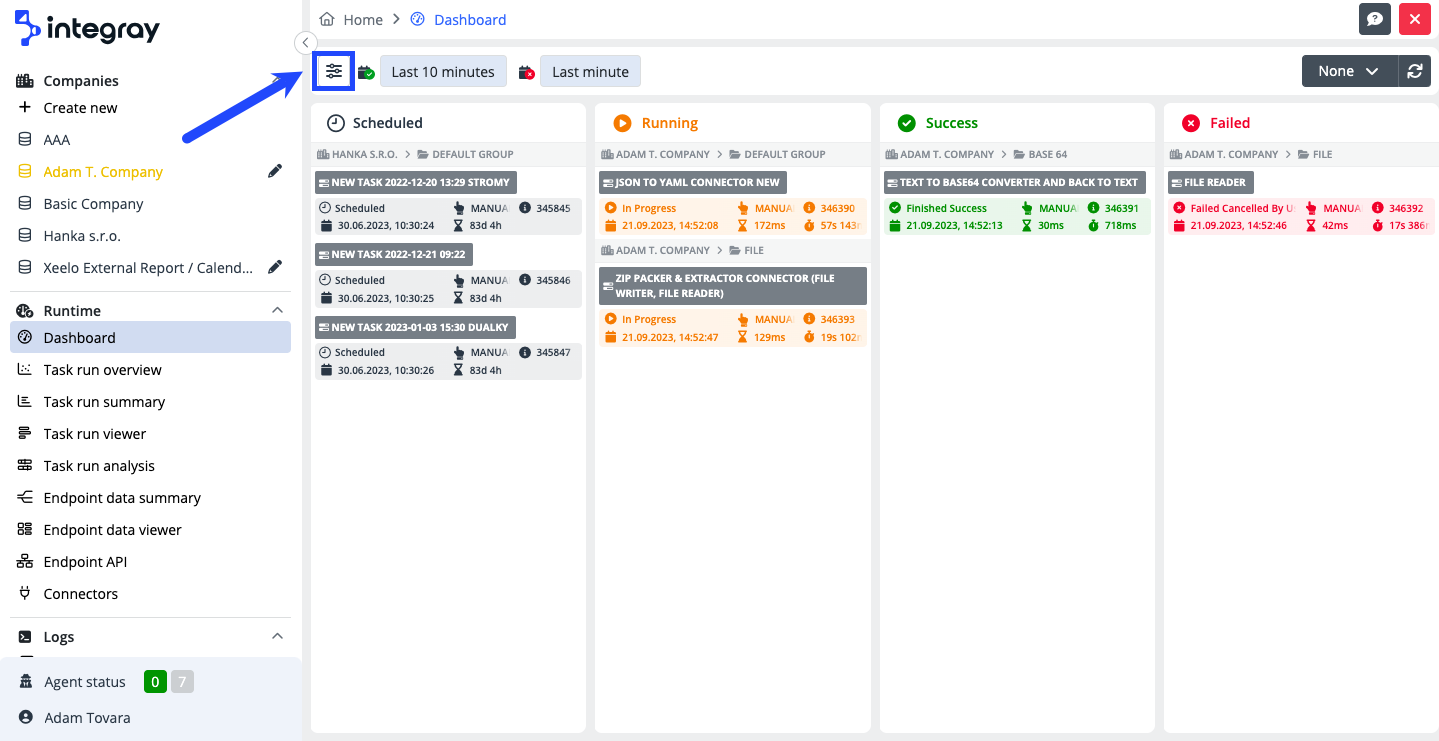
The data set in the Dashboard can be narrowed down to the required result by using the built-in filters.
You can enter the built-in filters by clicking the sliders button on the left side of the dashboard filter menu and opening the modal dialog window FIlter settings.
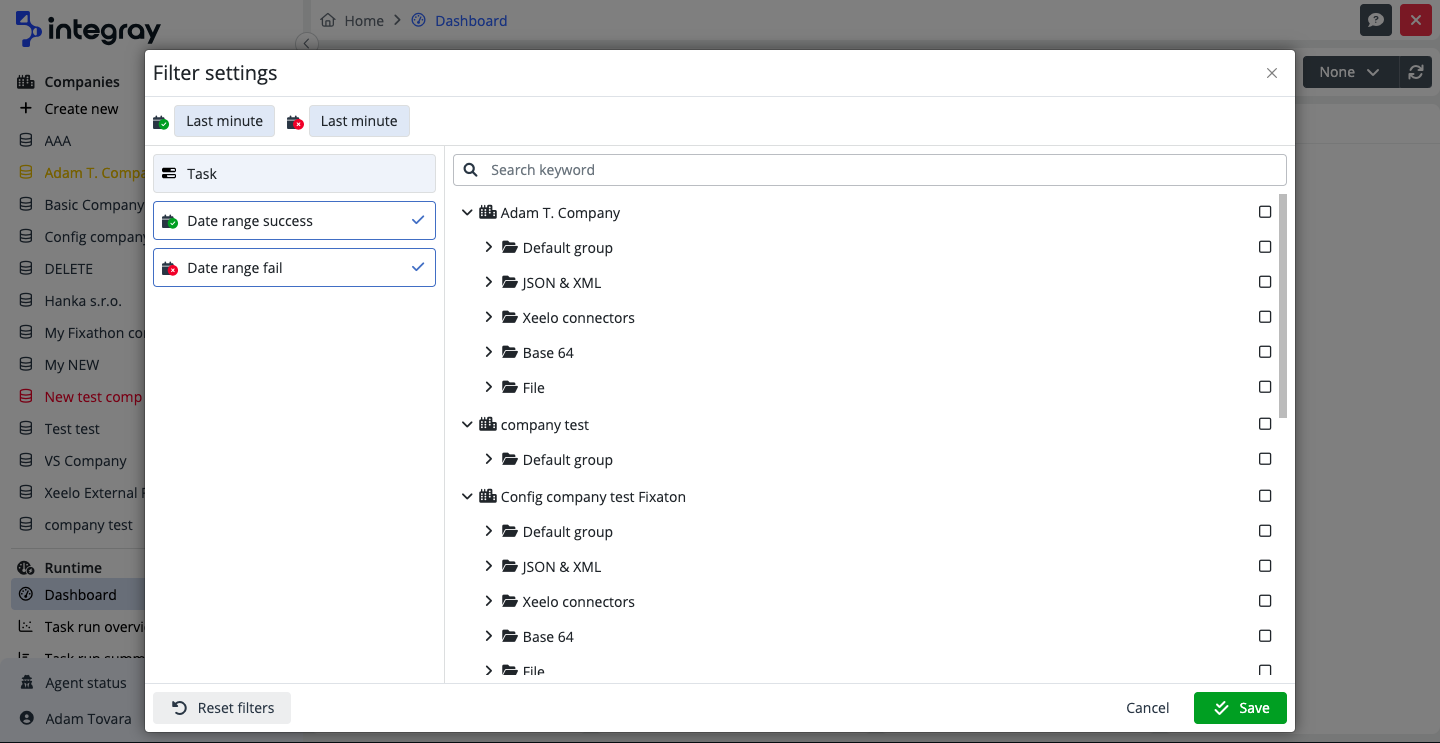
Built-in filters
-
Task - This filters a single or more tasks, or filters the tasks of the entire company, or those of the task group.
-
Date range success - This filters only successful tasks, using either predefined periods or custom ones.
-
Date range fail - This filters only failed tasks, using either predefined periods or custom ones.
Usage of the filters:
Choose the required type of filter on the left side and configure it on the right side. Used filters are marked with an active marker icon on the left side, as well as those are visible as buttons on the filter menu and preview. To cancel the active filter, click the cross icon on the right side of the button. If the button does not contain a cross to remove the filter, it means the filter is default and can't be removed. You can reset all the filters by clicking the Reset filters button in the left bottom corner of the Filter settings. The filter will be set to the default values.
Warning
The views on the Dashboard for Task runs with the statuses 'Scheduled' and 'Failed' are not limited in any way. However, for Task runs with a 'Success' status, there is a limit of 5 records for a given Task run.