History view
The history view displays the task runs's details within the selected date range. From here, you can enter the data viewer and see the data (dependent on the applied configuration), task run log of the selected task run, and the debug mode of the task steps. You can also restart the task from here.
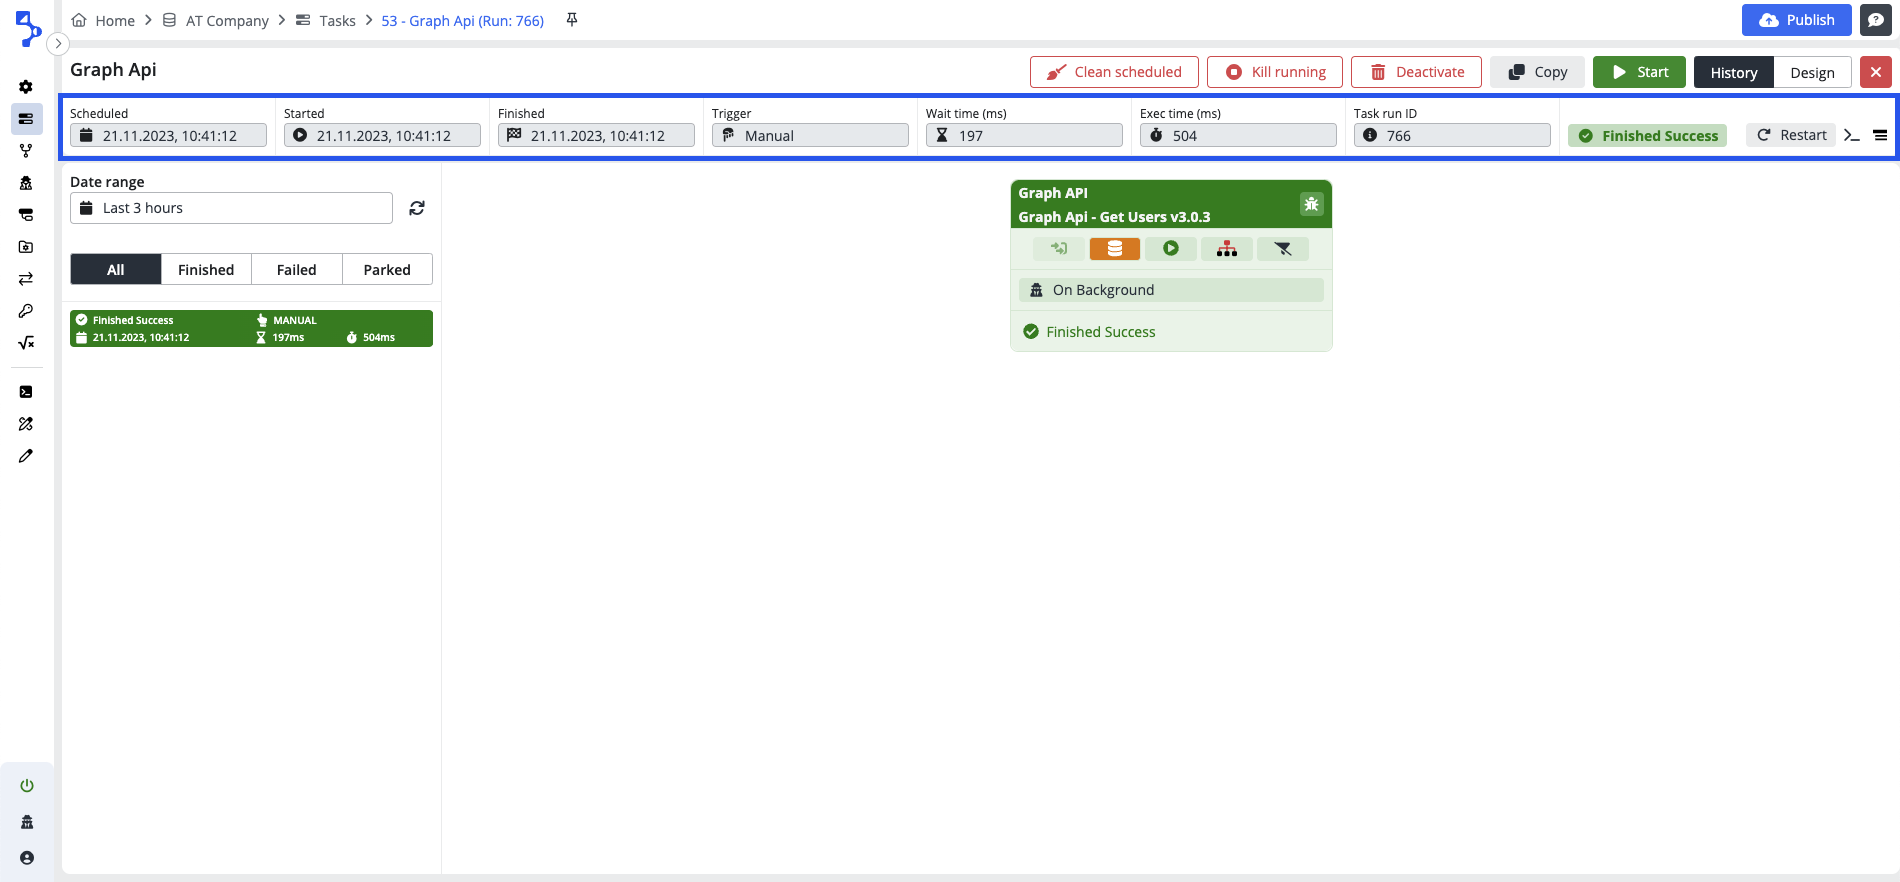
In the history view, there is no change to the Task header menu. However, the Task header design menu dynamically changes into the Task header history menu. You can explore the Task Run History section, displaying a set of task runs within the specified date range filter.
Task header history menu
-
Scheduled - Displays the scheduled date and time of the selected task run in the task run history.
-
Started - Displays the start date and time of the selected task run in the task run history.
-
Finished - Displays the finish date and time of the selected task run in the task run history.
-
Trigger - Displays the trigger of the selected task run in the task run history.
-
Wait time (ms) - Displays the waiting time - difference between started and scheduled times of the selected task run in task run history.
-
Exec time (ms) - Displays the execution time - difference between the finished and started times of the selected task run in task run history.
-
Task run ID - The task run ID of the selected task run.
-
Task run status - The task run status of the selected task run. (Finished, Failed, In progress, Scheduled)
-
Restart button - Allows you to restart the Task run
-
Task run log - The option opens a sidebar docked on the right side of the screen with data logged based on the settings defined in the Task run log writer.
Levels filter - Filter to display required levels of available logs. It is not possible to display levels on the task run history log which are not defined in the Task run log writer.
Step filter - Filter to display required task step logs only.
-
Normal/Detail view - Enables the expansion of the task step configuration element in the task editor. There are only 2 levels of detail available.
Task run status
Task Run Status is a visual check located in the top right corner of the History view.
There are three types of runs:
- Finished The task run has concluded successfully.
- Failed The task run has concluded unsuccessfully.
- In Progress The task run is currently ongoing. You can halt this process by clicking
Cancel.
- Scheduled The task run is planned. You can pause this run by clicking
Parkand resume it later by clickingUnpark.
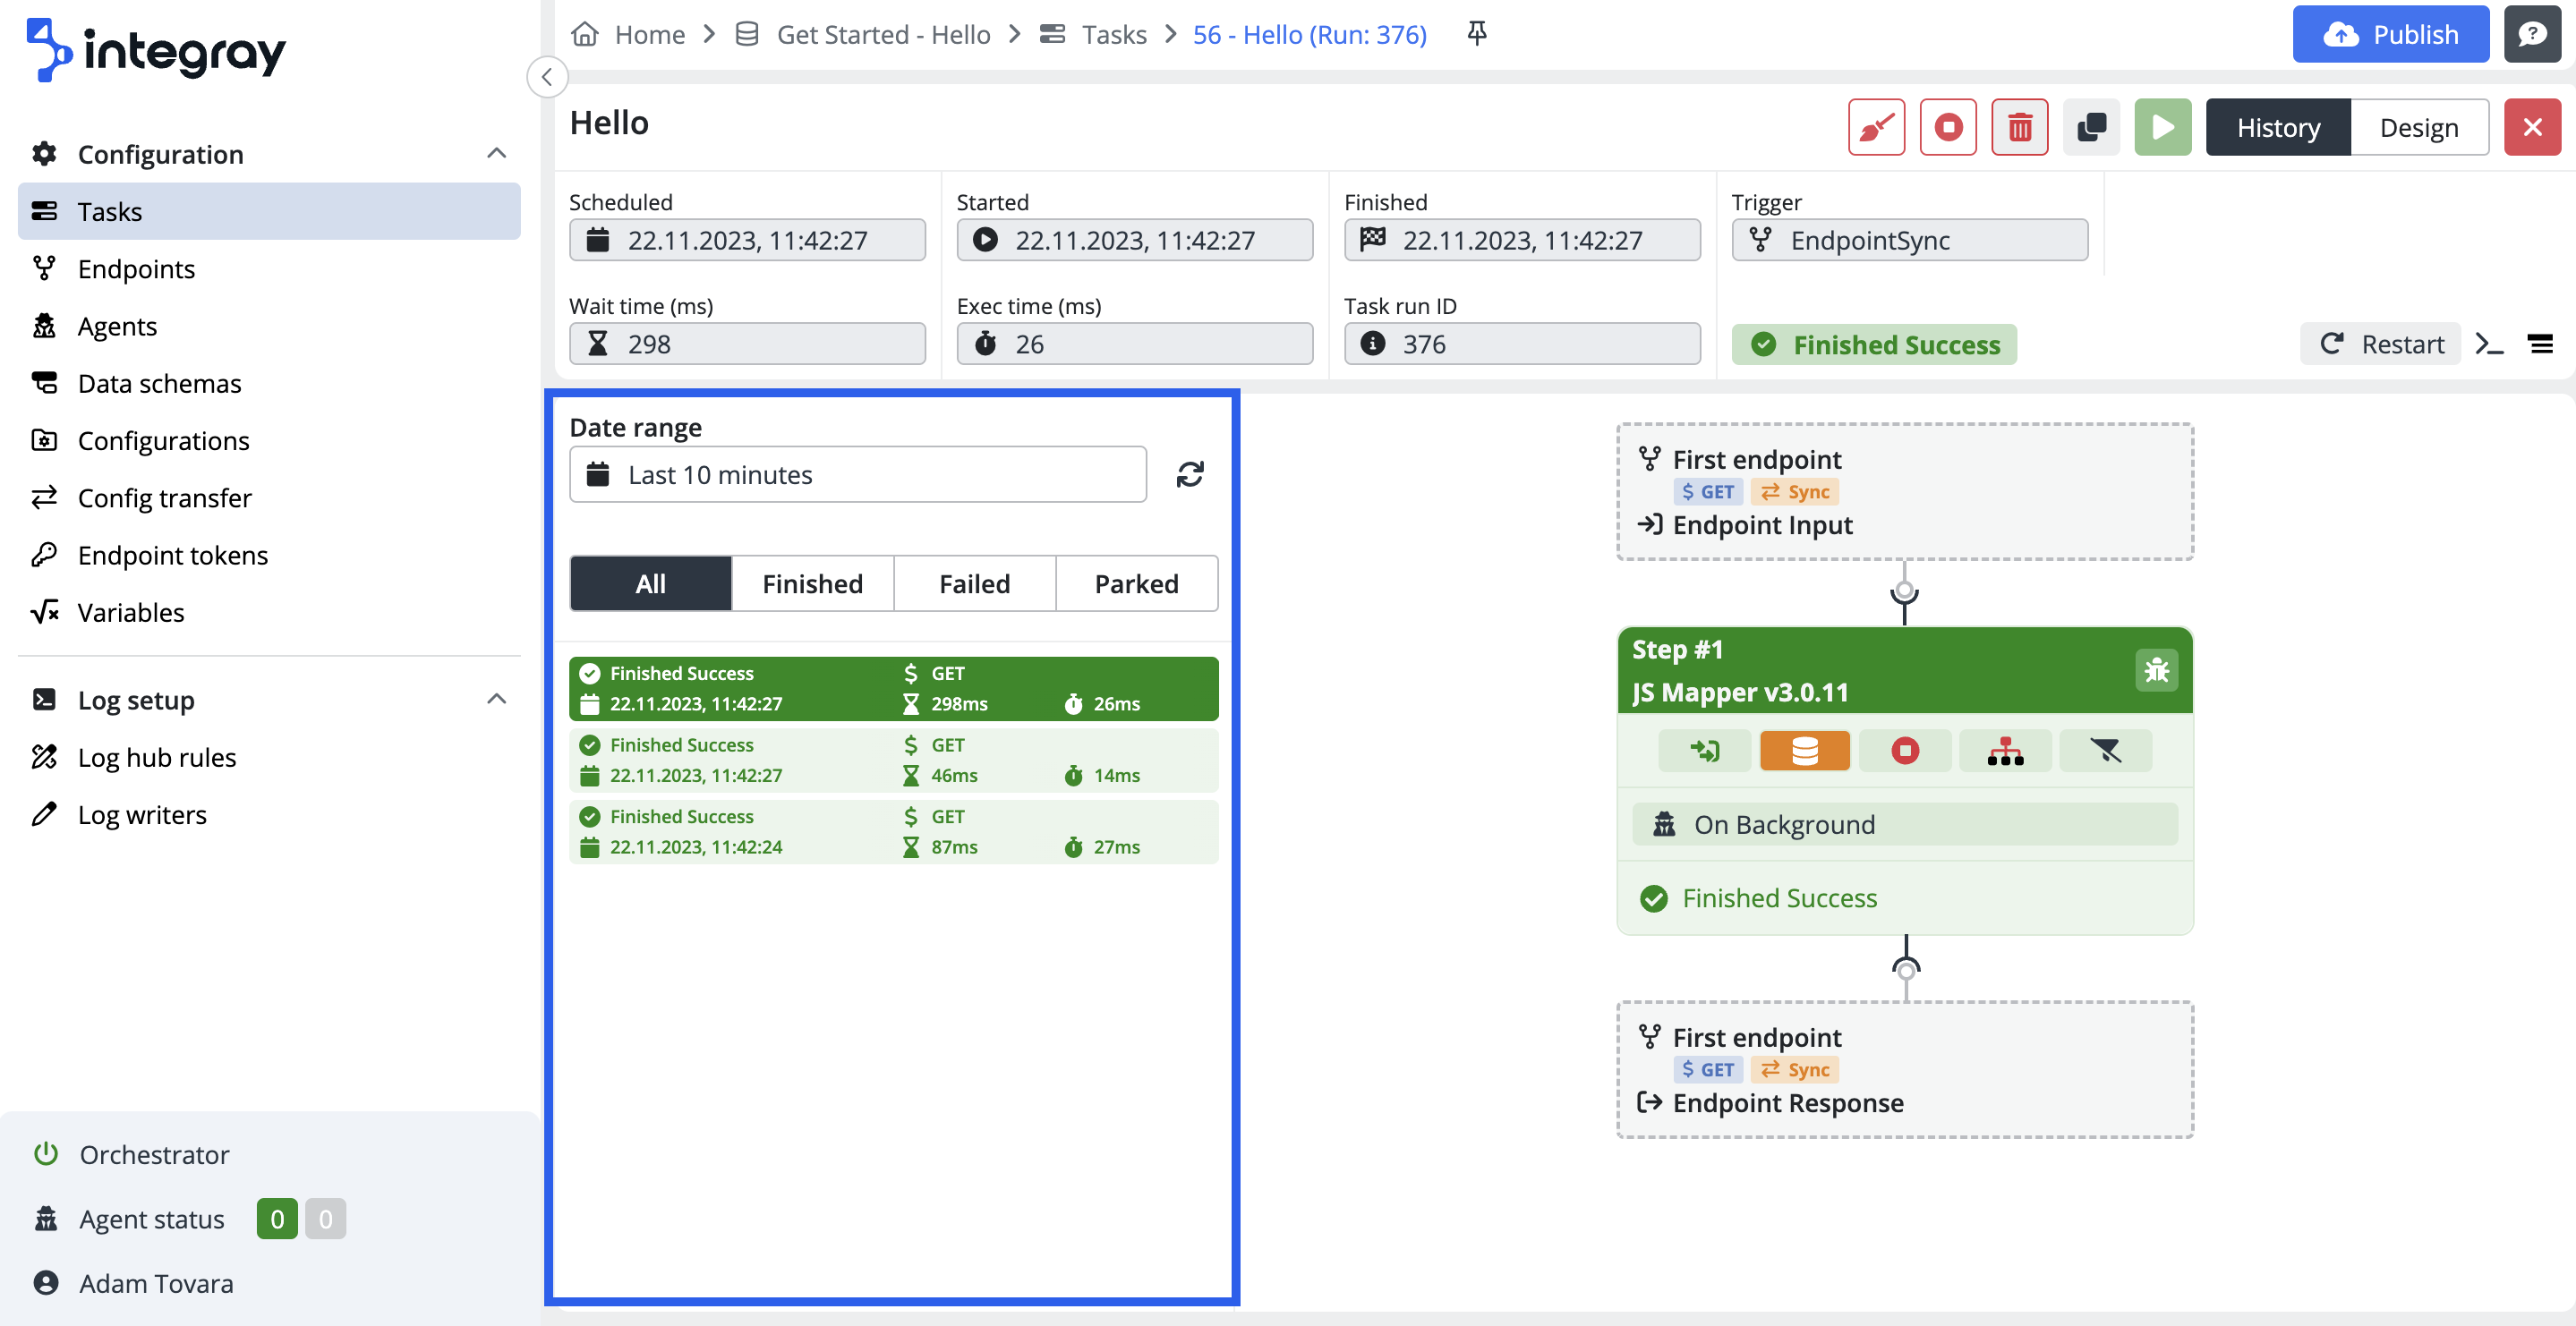
Task run history
Date range
Data range filter constraints the displayed task run history based on selected period.
Bulit-in ranges: Last minute, Last 5 minutes. Last 10 minutes, Last hour, Last 3 hours, Last 12 hours, Last 24 hours, Last week.
Select Custom to define individual date/time range.
Task run filters
Besides the data range time constraint, the next filter based on completion status is available to narrow down the displayed set of task runs.
All runs
An entire set of task runs considering period specified in the data range filter.
Finished
Finished task runs within the specified period in the range filter. Finished tasks can be further differentiated to:
| Status | Desription |
|---|---|
| Finished: Success | Task run finished according to expectation, all taks steps finished successfully with no errors. |
| Finished: No data | Task run finished, one of the executed task steps didn't produce any data. |
| Finished: With errors | Task run finished, but errors were encountered on one of the task steps. Task run will end in this type of status only in case of error behavior set up: "Fail step" or "Fail step & continue". In case of error behavior set up: "Fail task" or "Fail task & continue", the task run status will be set to Failed. |
Failed
Failed task runs within the specified period in the data range filter. Failed tasks can be further differentiated due to failure reason into:
| Status | Desription |
|---|---|
| Failed: Connector | The connector configured on the task is unable to perform the required activity. The most probable reason for failure will be the incorrect or missing configuration or setup. |
| Failed: Agent killed | The remote agent executing a task was killed while performing the task. |
| Failed: Timeout | Task execution fails to complete within the timeout period set for the task. |
| Failed: Cancelled by user | Taskrun killed/terminated by the user using the Kill running button. |
| Failed: Runtime | Usually cardinal issue of the platform related to the platform core, database, etc. |
| Failed: Agent | The remote agent failed to execute the task. The agent is damaged, but not killed. |
| Failed: Output | Failure to put the data out. The issue with the output schema. |
| Failed: Input | Failure to put the data in. The issue with the input schema. |
Parked
An entire set of parked task runs considering period specified in the data range filter.
Task run record
Displays the informaotion about the task runs in colored badges (see execution color-coding)
-
Status - The task run status (Finished, Failed, In progress, Scheduled).
-
Trigger - Based on the trigger initiating the task:
Manual,GET,POST,PUT,PATCH,DELETE,Scheduled. -
Scheduled time - Displays the scheduled date and time of the selected the task run in task run history.
-
Wait time - Displays the waiting time - difference between started and scheduled times of the selected task run in task run history.
-
Execution time - Displays the execution time - difference between the finished and started times of the selected task run in task run history.
-
Execution status color-coding
Color code Desription Black Scheduled, not executed yet.(In case of black colorcode, check if the task in runnable.) Orange Currently being processed. Green Task run finished. Red Task run failed.
Task history editor
In the Task History Editor, the visual format mirrors that of the Task Design Editor. Nevertheless, unlike the design view, no edits are allowed in the history view. It solely displays the configurations of individual task steps. There are two active elements within this editor:
- Data Snapshot button (active based on the settings of the given task step)
This button opens the Data Viewer modal, which displays a data structure created by concatenating the output of the current step with all preceding steps.
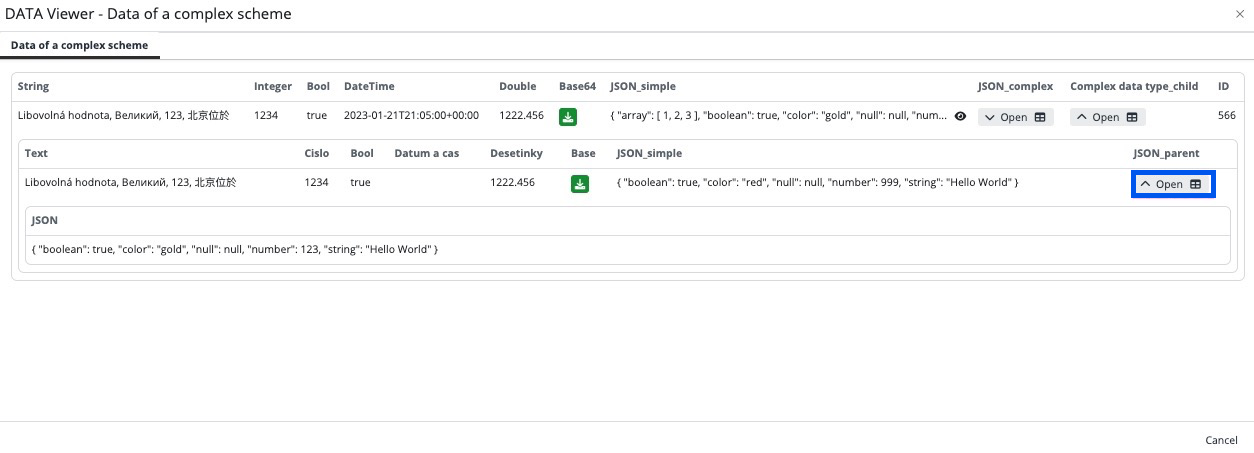
Data Viewer graphically distinguishes what the result is. When the data viewer is expanded, it is possible to determine from the image whether it is a Step or Data of a complex schema.
Data Viewer ellipsis in case of longer data
If the log in Data Viewer is too lengthy, you can expand it by clicking on the "eye" symbol to ensure all data is visible.
- Debug button, which opens the mode for debugging of your configuration. More about the Debug mode


