Debug mode
The debug mode aids integrators in understanding, diagnosing, and resolving issues within an integration configuration, leading to improved integration quality and a better user experience.
The advantage of the debug mode compared to the standard design is that you are freed from saving and publishing the changes when tuning. You can focus on tuning of single step instead of running the whole integration.
The logs in the debug mode also bypass the standard log hub rules and write the entire details of all available log levels i.e. Trace, Debug, Info, Warning, Error, Fatal.
The debug mode is executed either on the background or remote agent based on the task step definition (what agent is used in the debugged step).
Not supported connectors in debug mode
If you see the error message "This connector was executed on incompatible runtime. Please see the documentation of connector to check prerequisites." it means this connector is not supported in debug mode.
The debug mode will be found:
-
on the task step editor,
-
on the task run history (on the task step level).
Debug mode is not a sandbox - it executes the configuration
Be aware, that the execution of the step in debug mode is performing the actions defined in the configuration.
Example: if in debug mode, the SQL statement contains the command "update" and the action is executed, the update will be performed on the connected database.
Debug mode view
The debug mode view is similar to the task step design view, but not the same. It consists of the following parts:
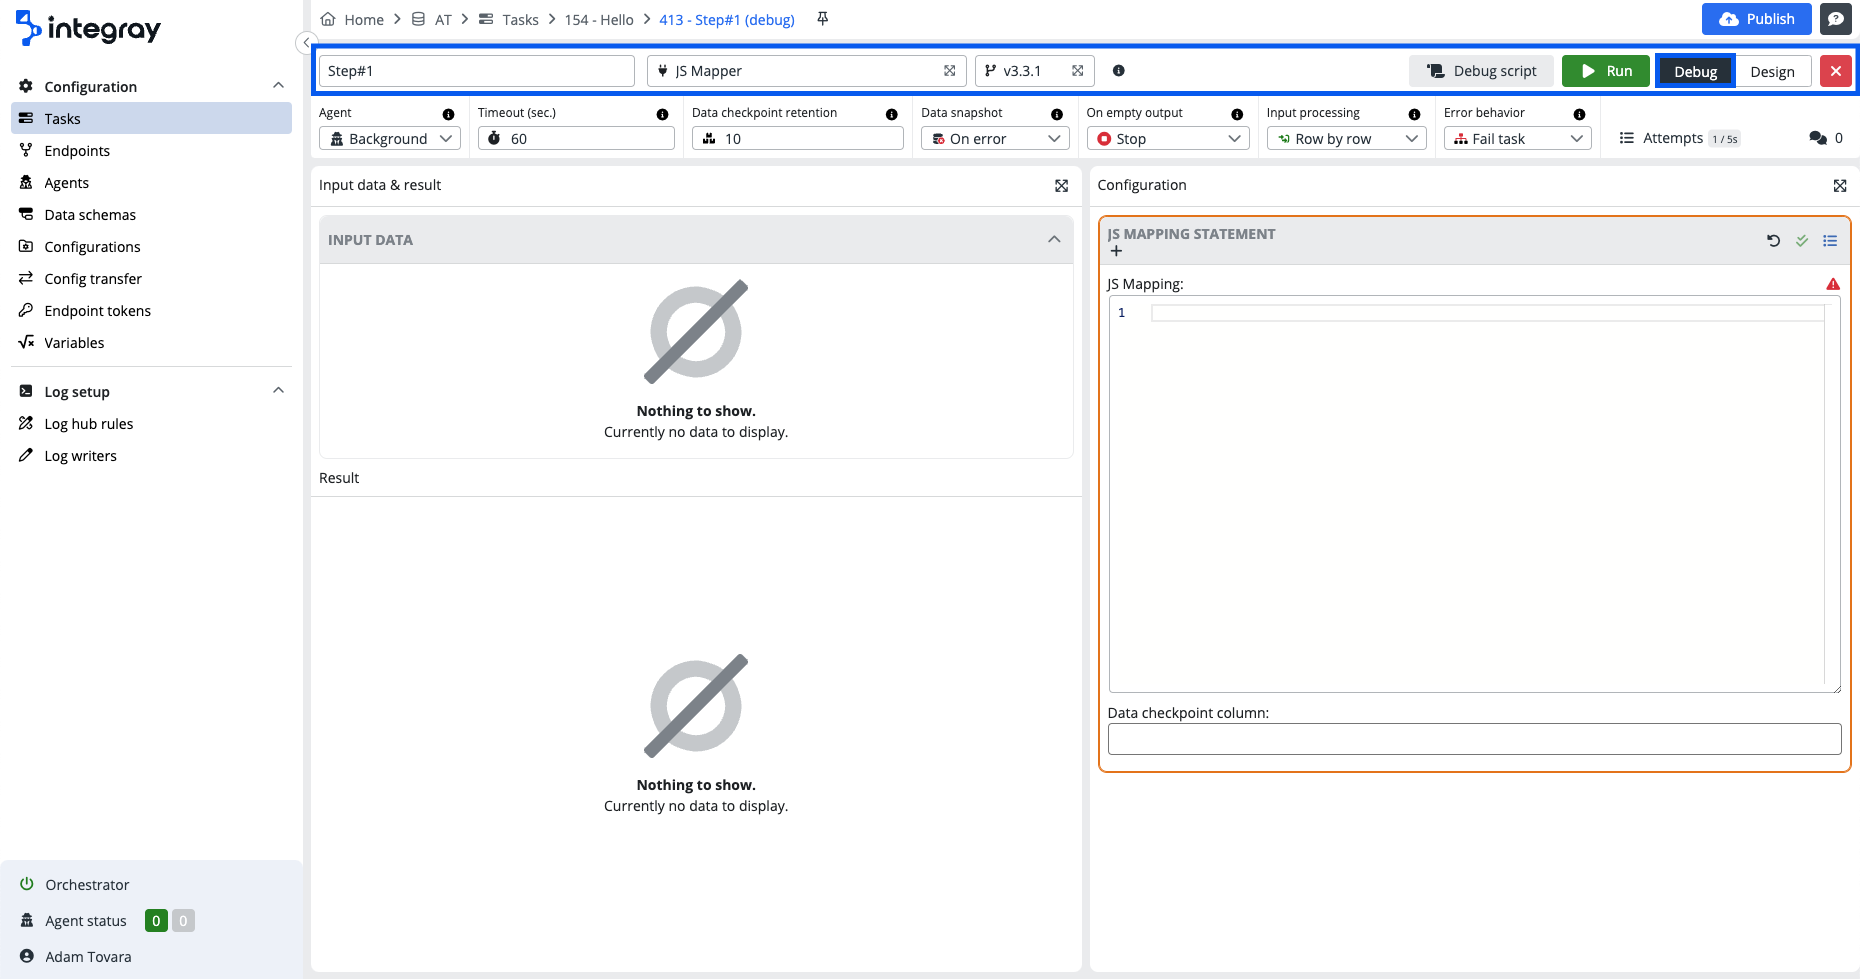
Debug mode title header
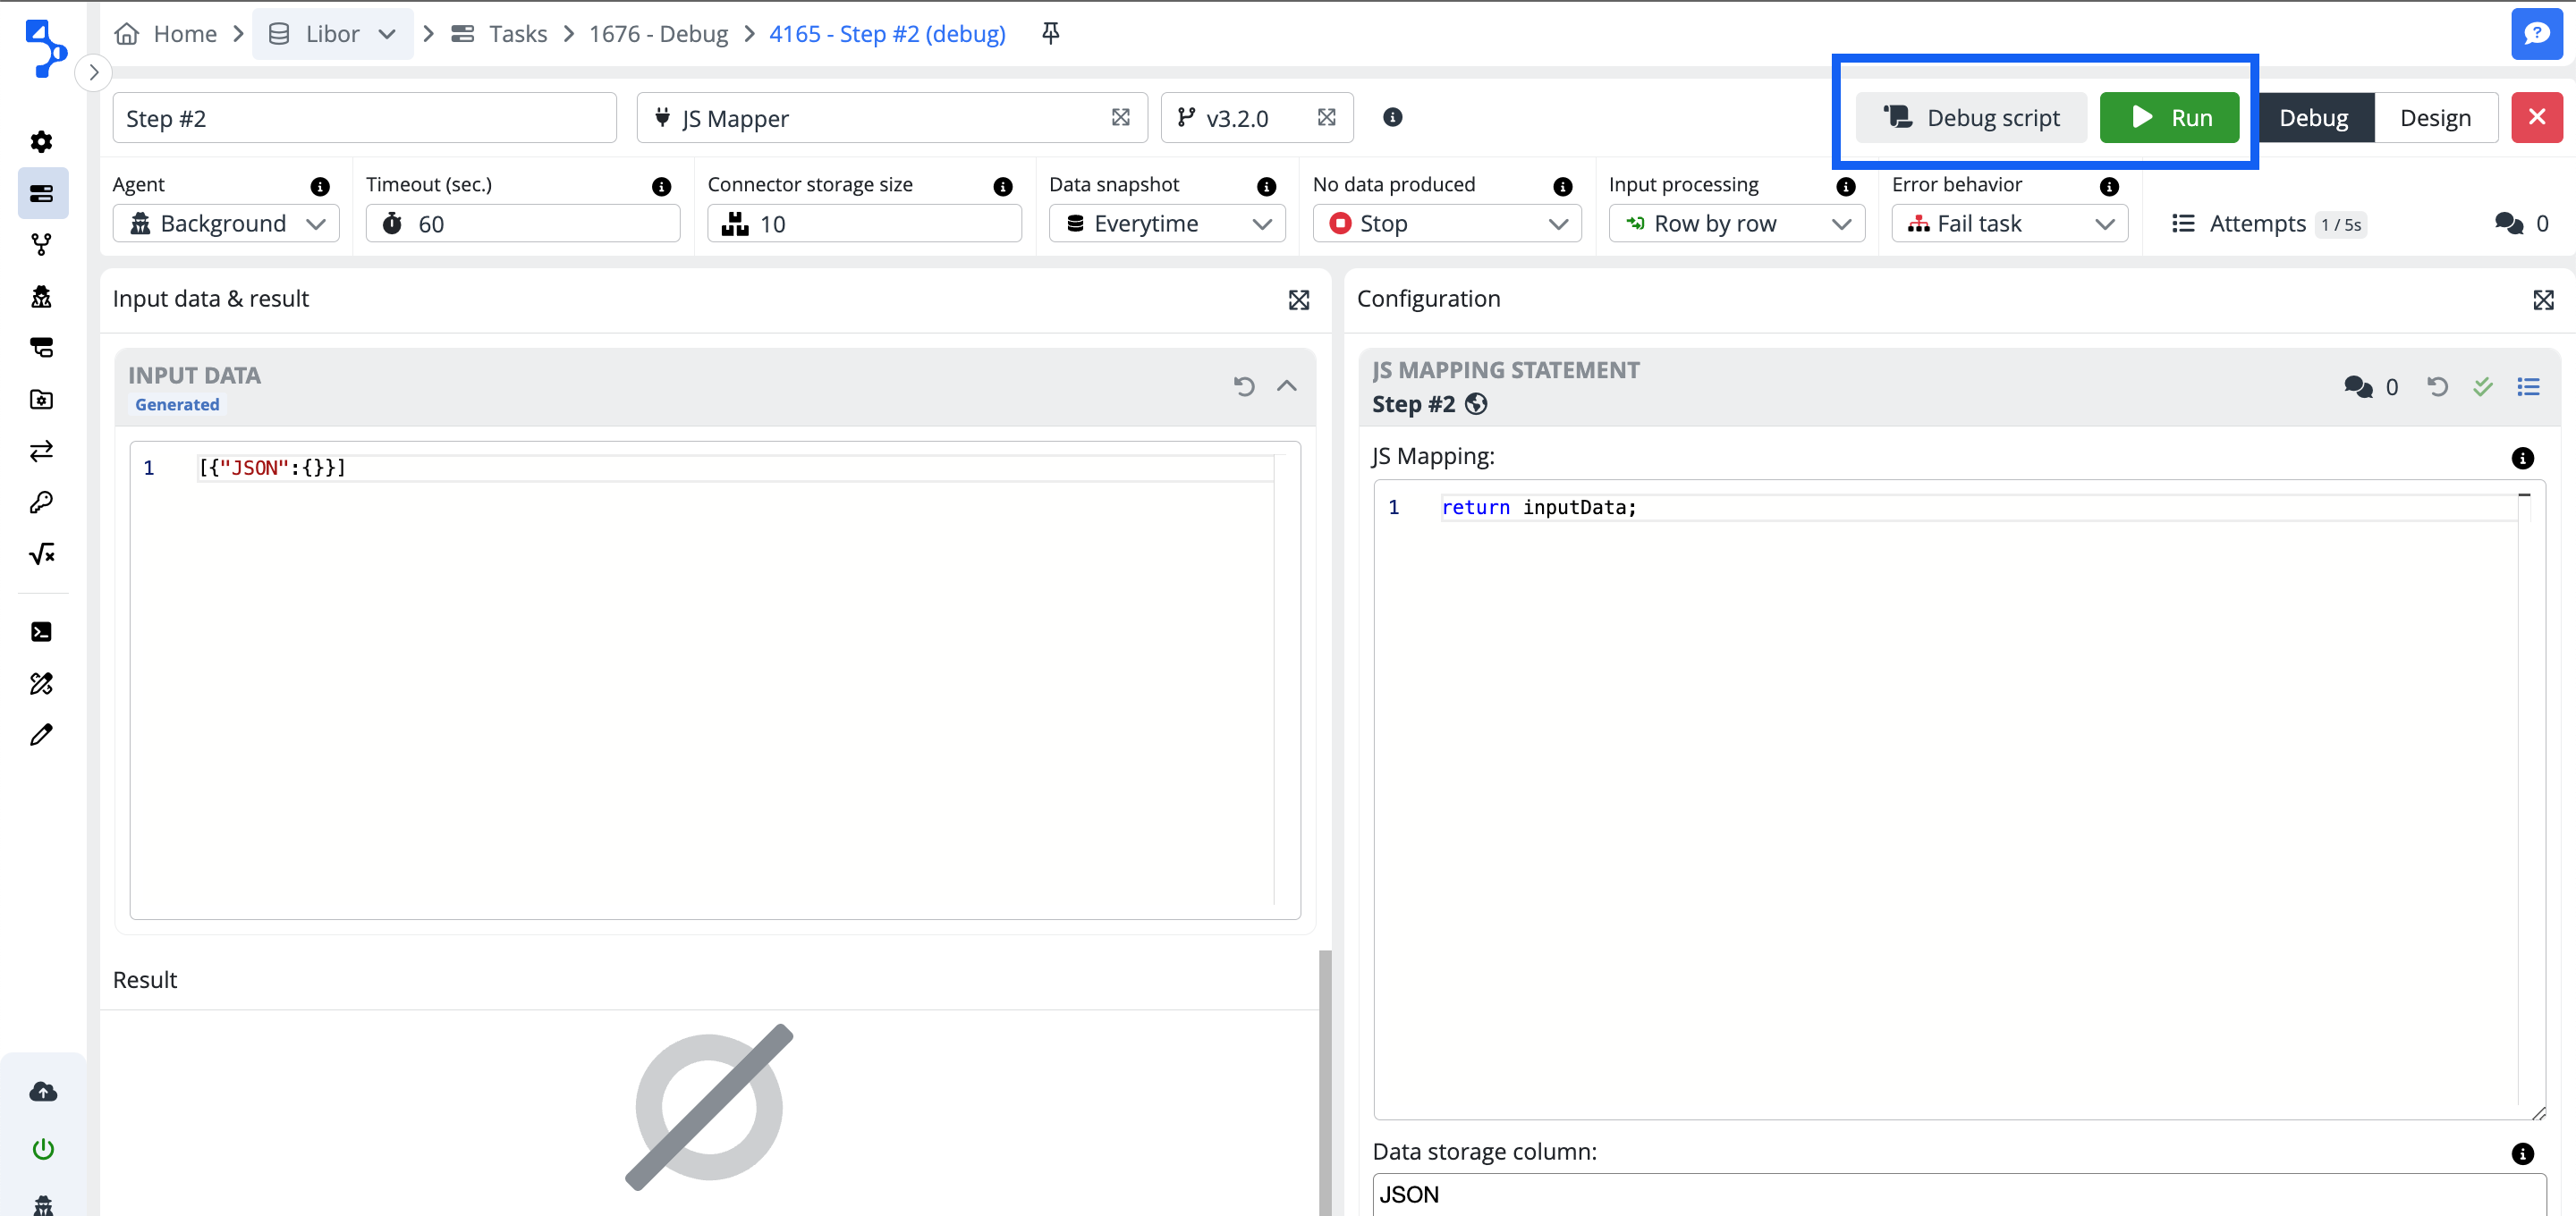
Compared to the task step title header, here you will find additional buttons:
-
Run - Run and execute the debug step.
-
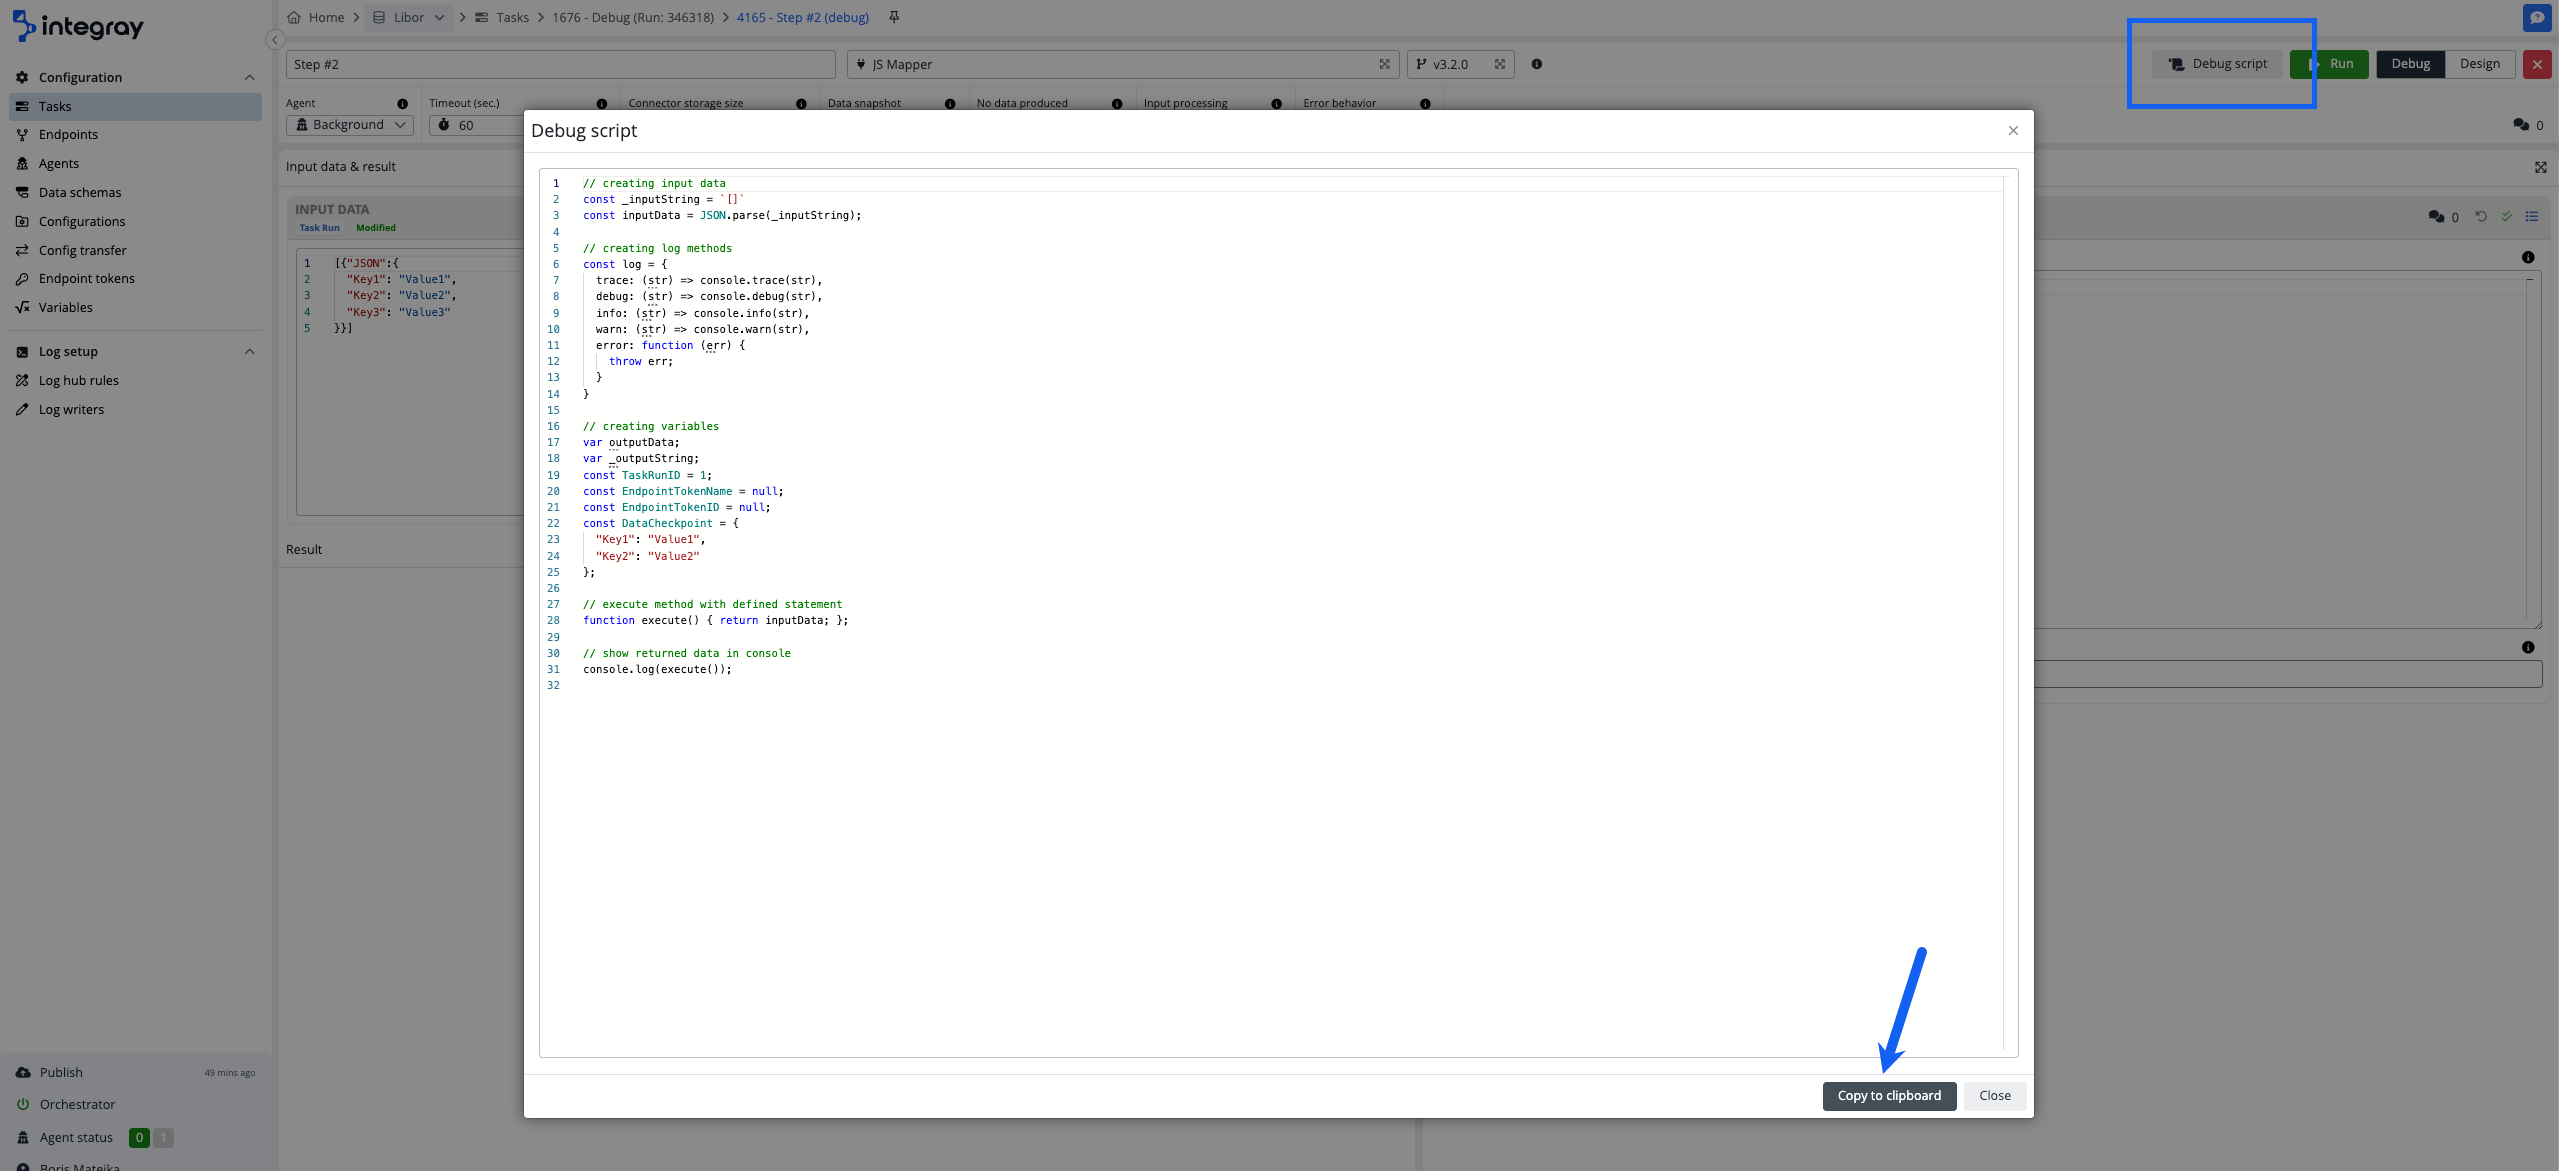
Debug script - Generate and display the full JS debug script.
To switch from the Design view to the Debug mode, click the Debug button when in the design view or click the green bug icon, in the top right on the task step container when in the task run history view.
Debug mode configuration header
The debug mode configuration header is the same as the task step configuration header.
Input data
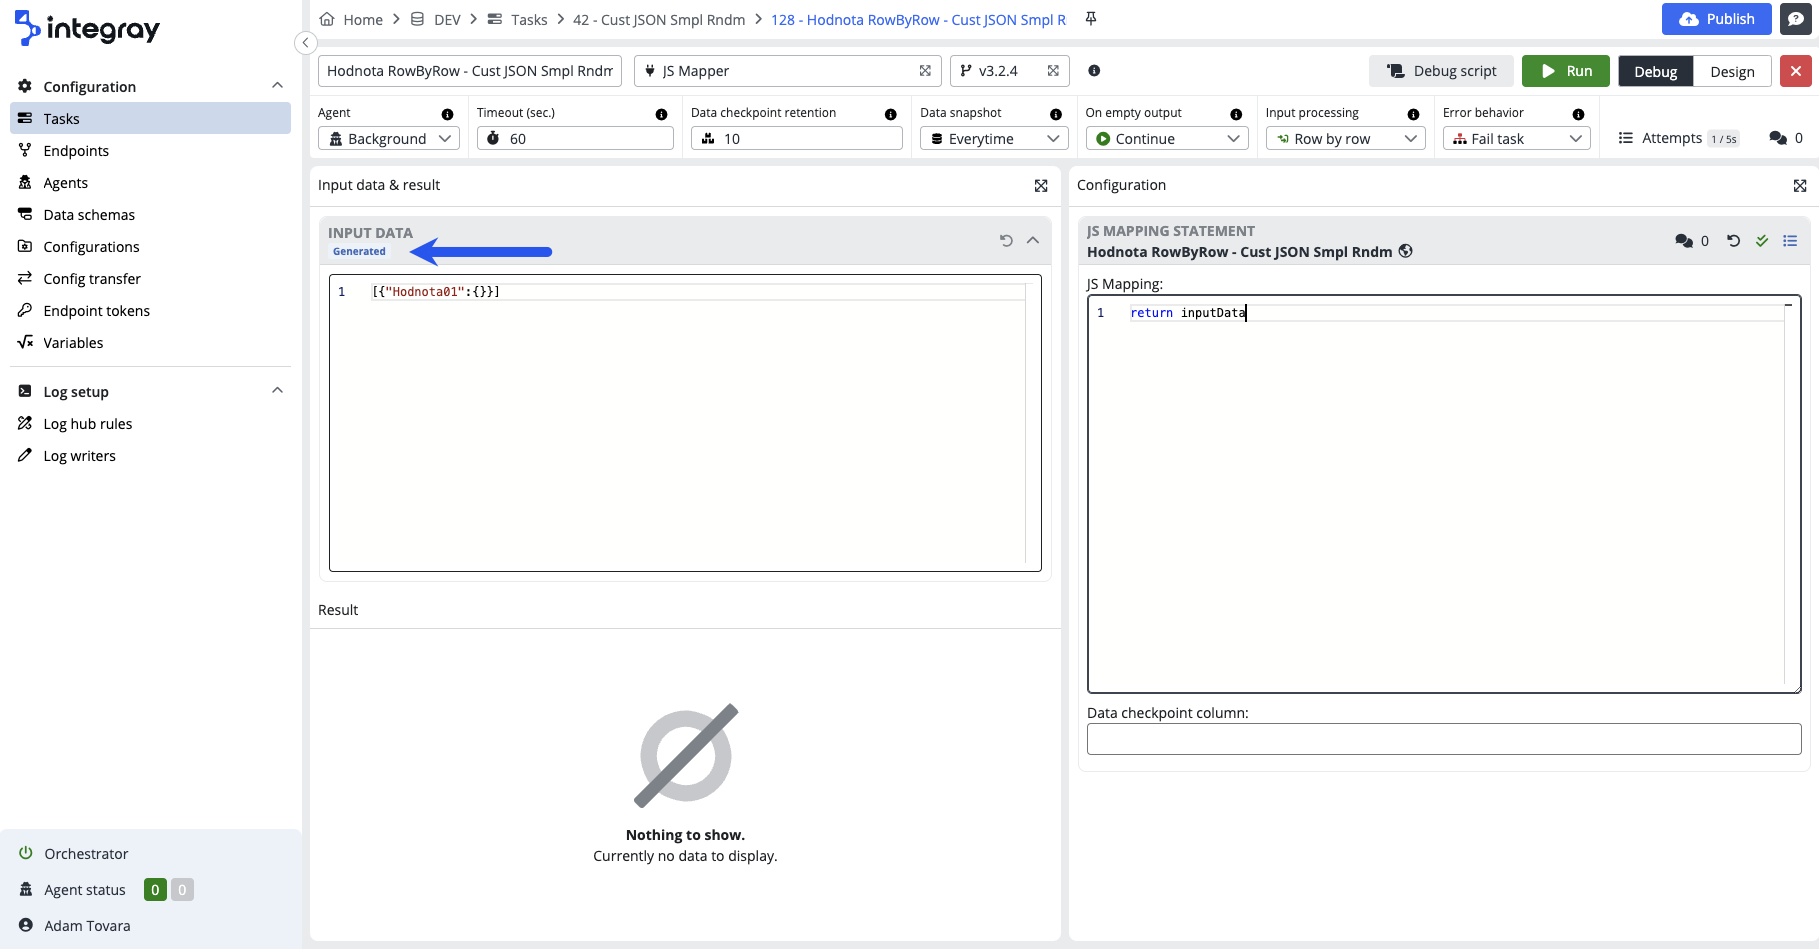
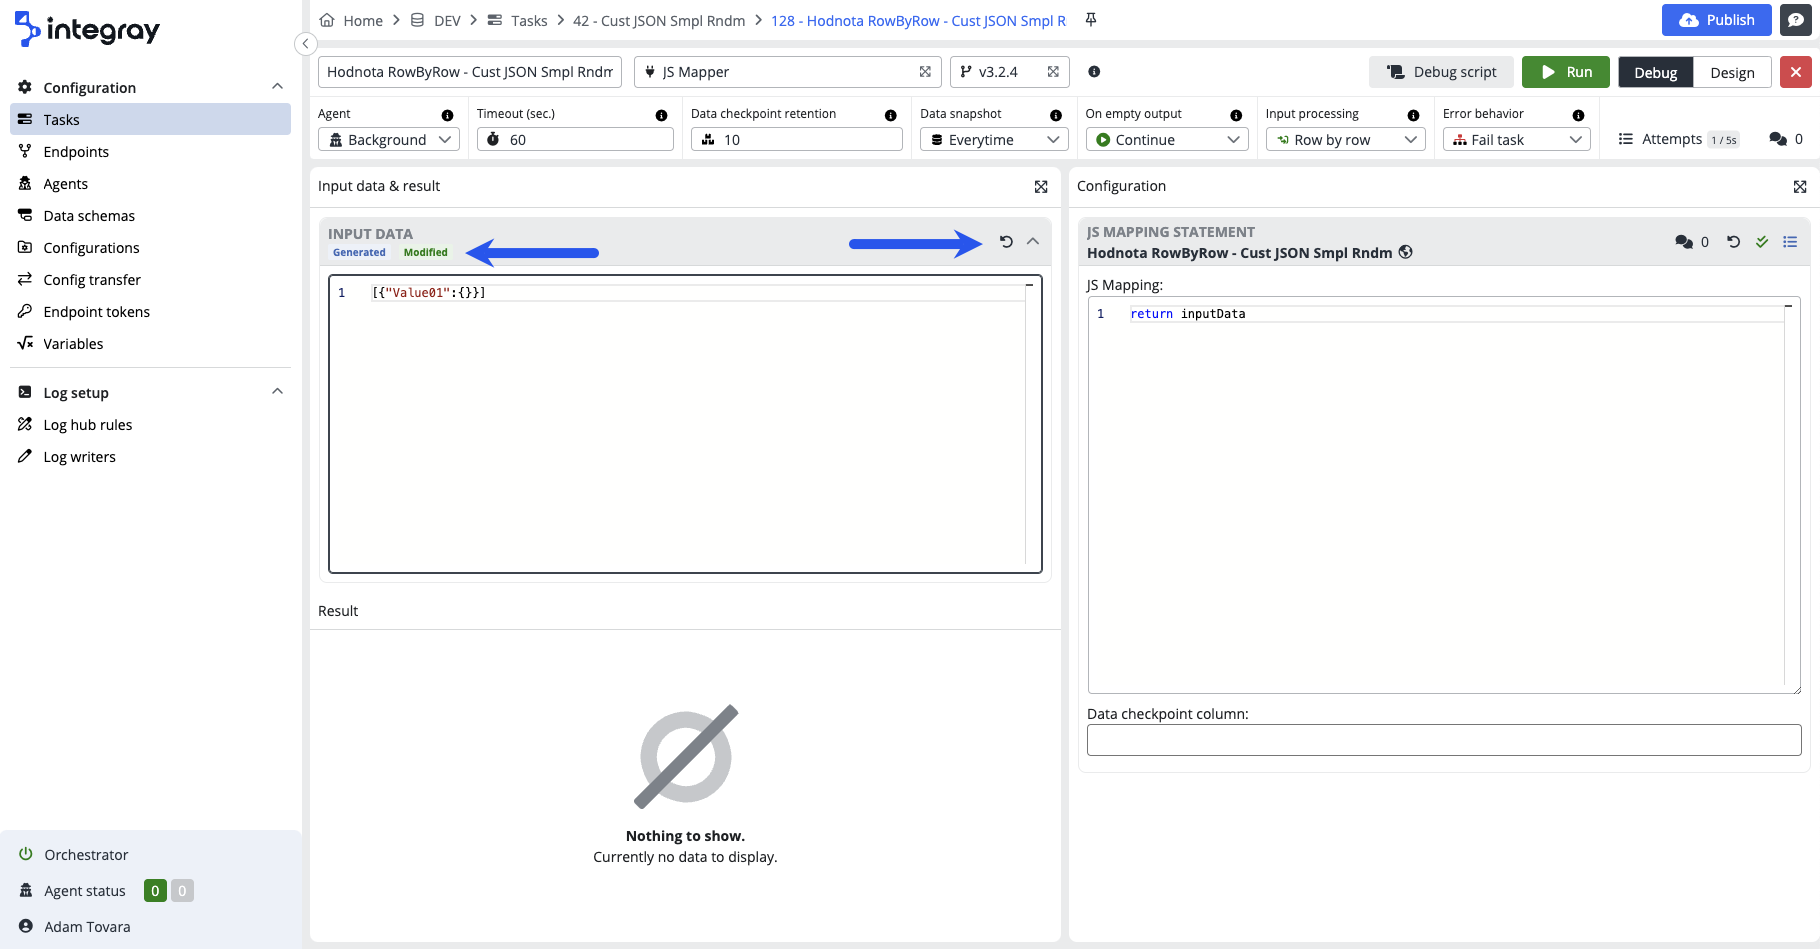
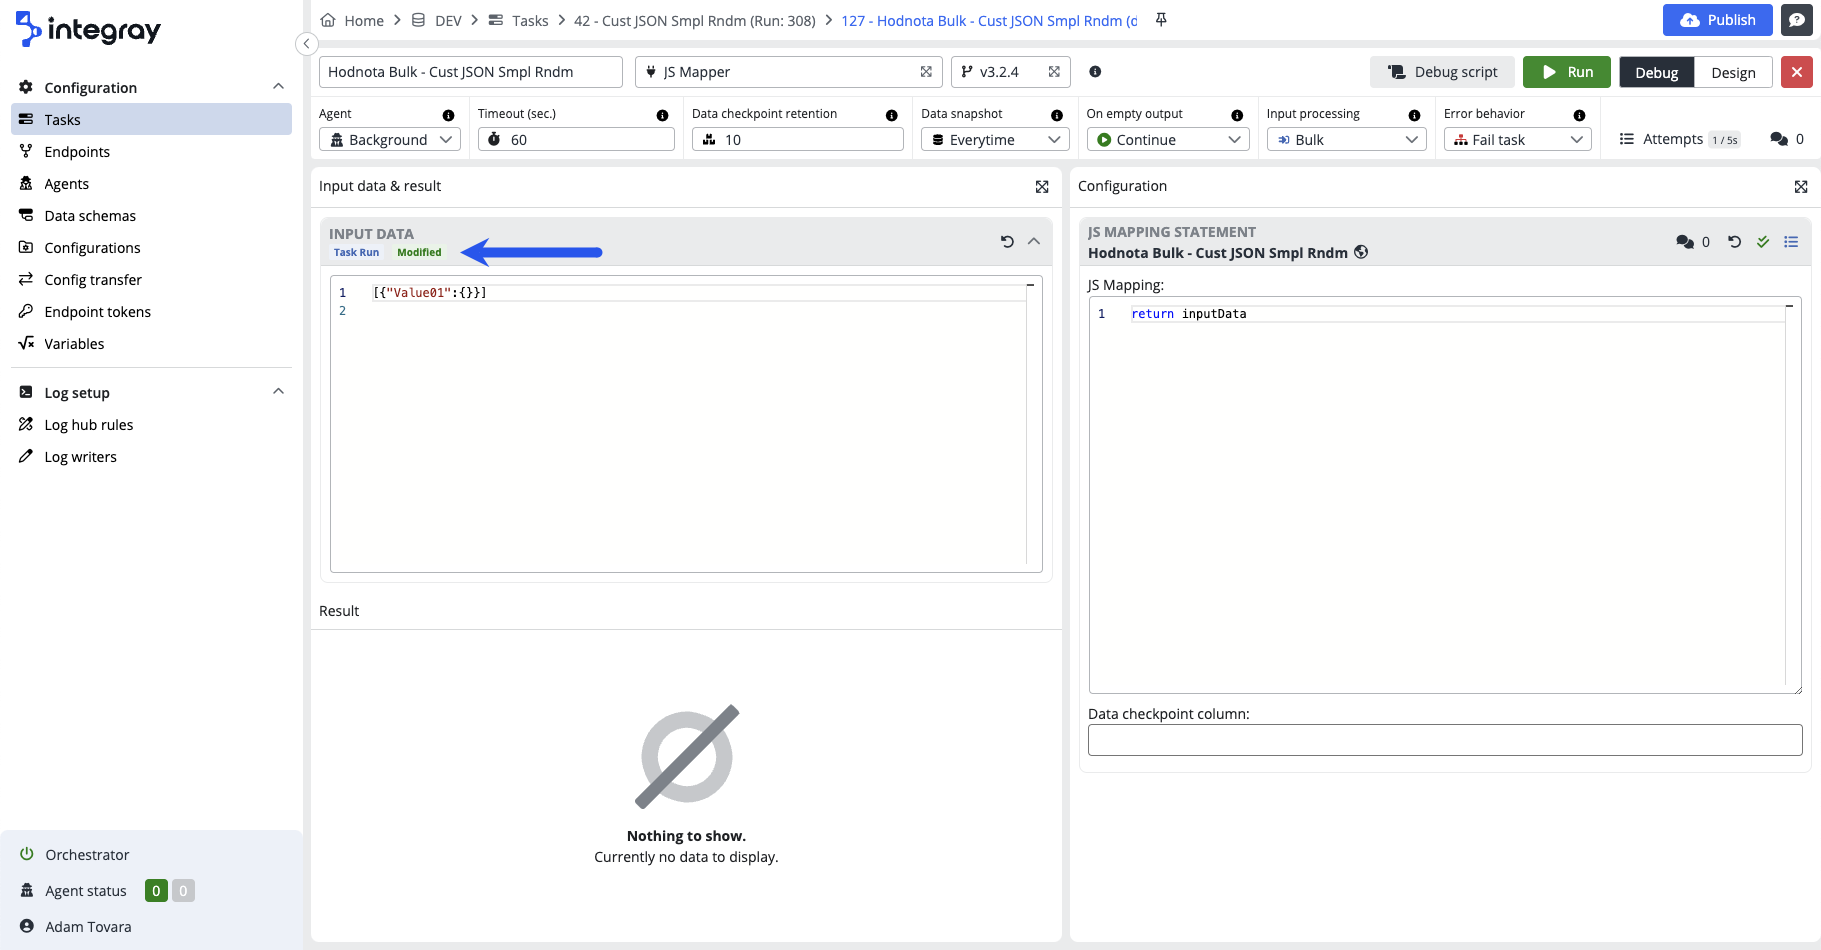
This is the part where you have your input data, either generated or from the task step data snapshot. You can modify the data and revert the data back to the original. There are colored badges indicating the source and the state of the data:
Generated - blue badge - the data are generated based on the input schema provided. Generated data are used for the debugging from the task step designer, where no data from data snapshots are available.
Modified - green badge - the modified badge indicates that the original generated or task run originated data were already modified by the user. You can always revert to the original data by clicking the rotate left icon in the top right corner of the input data part.
Task run - blue badge - the data are coming from the previous task step data snapshot. The task run data can be modified by the user. If modified, the green modified badge will be added.
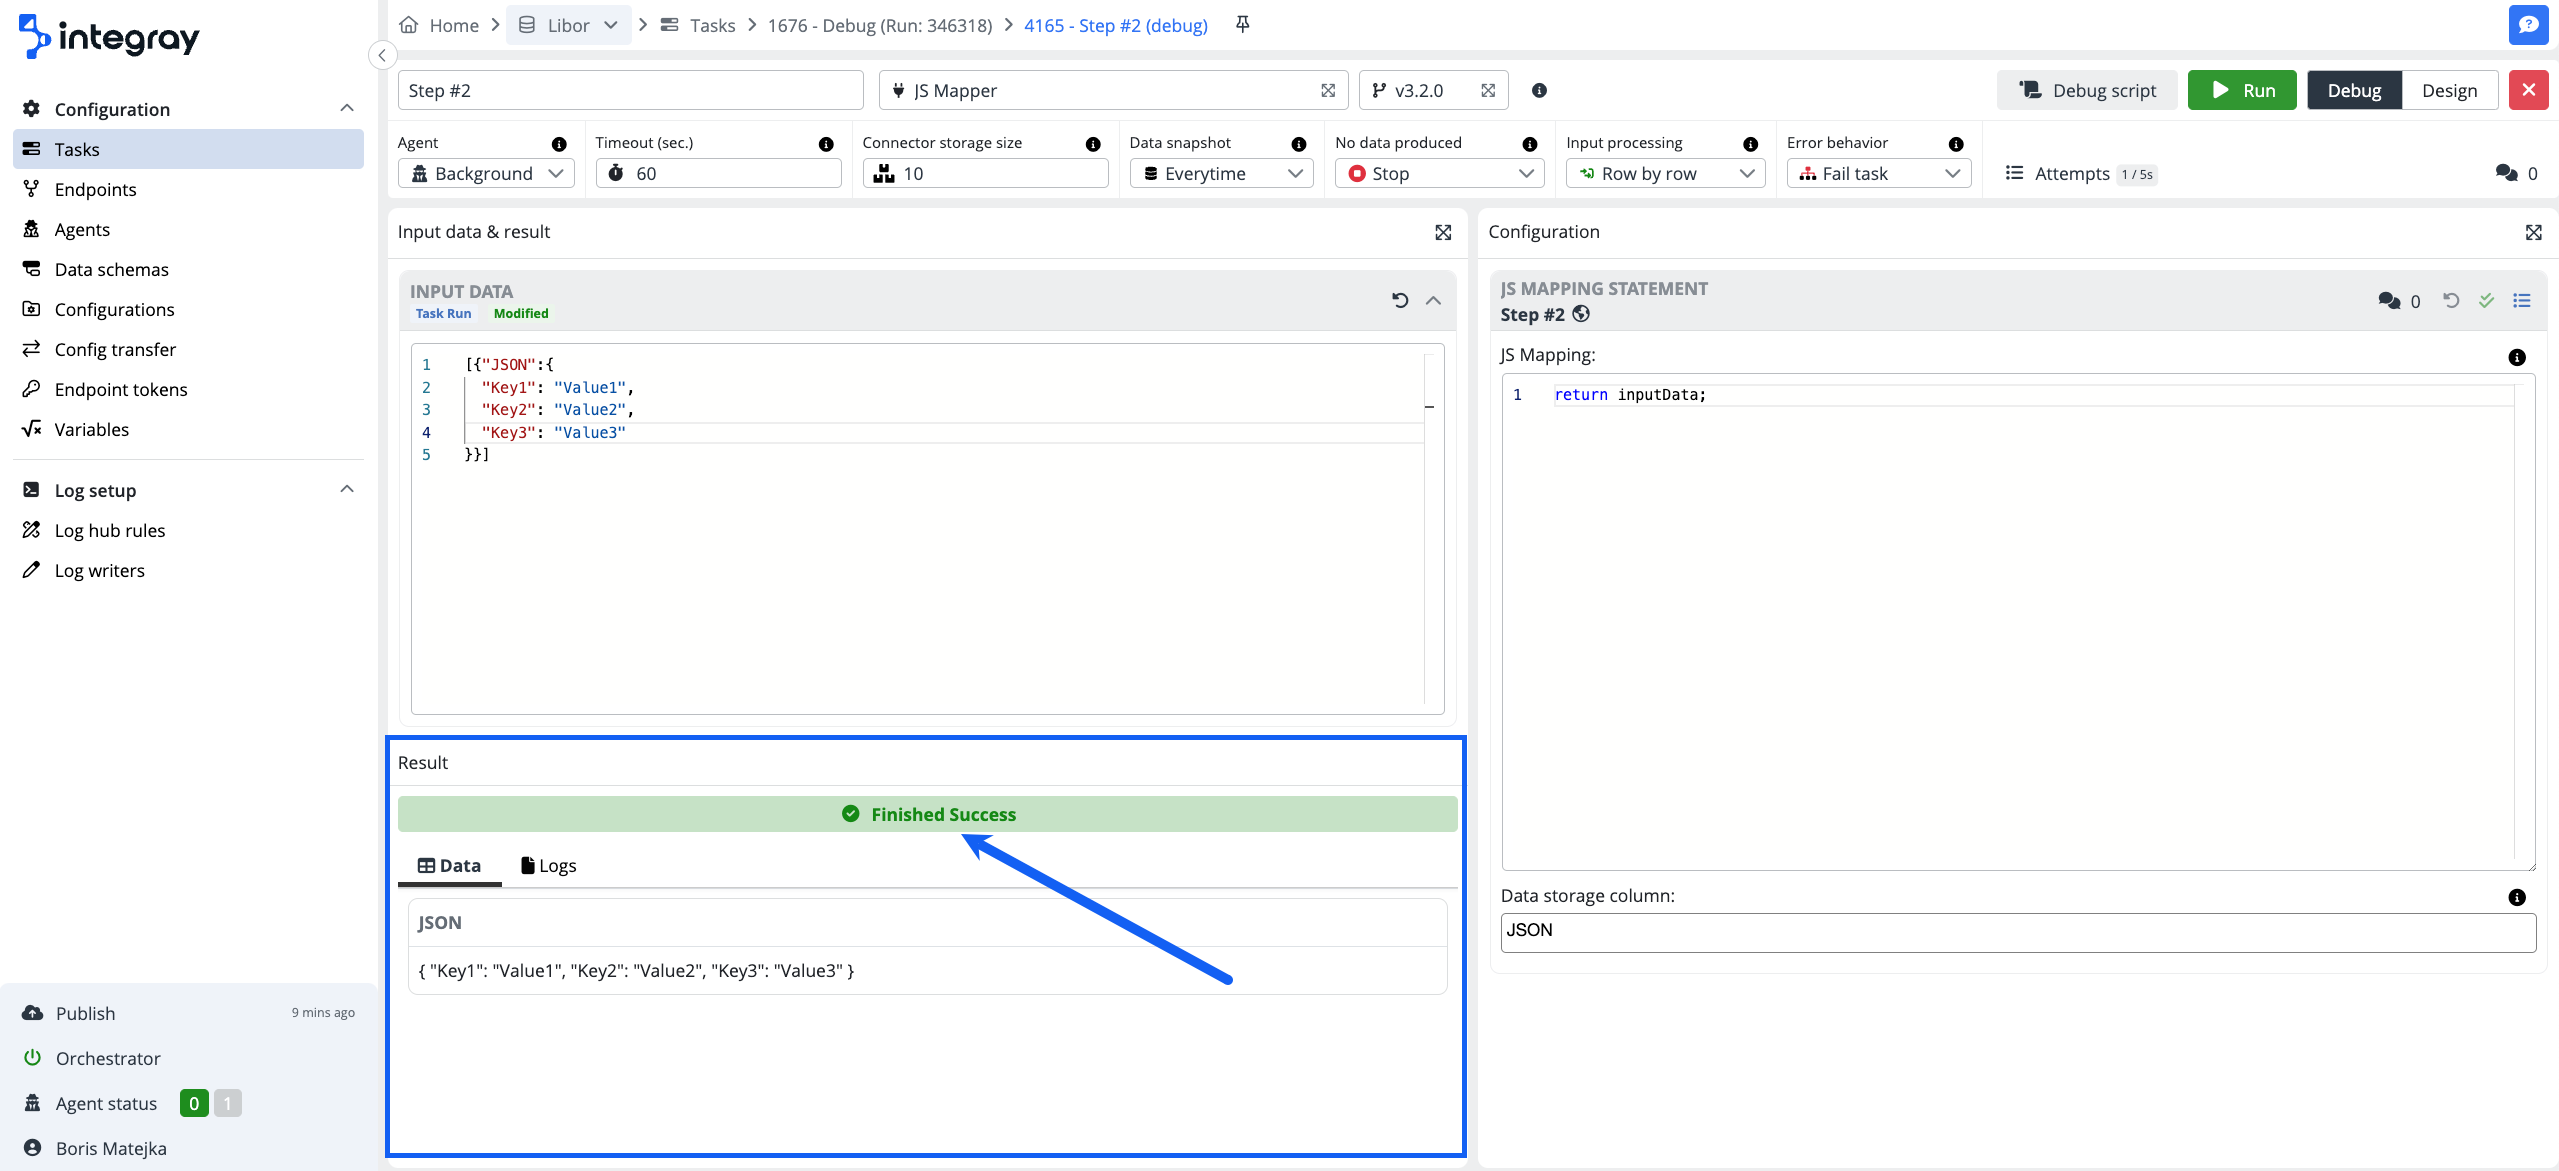
Result
The result part displays the following:
Status
This is analogical to the task run status, however, in the debug run, the status is tied to the result status of the particular step.
Data
The resulting data are based on the defined input and the configuration.
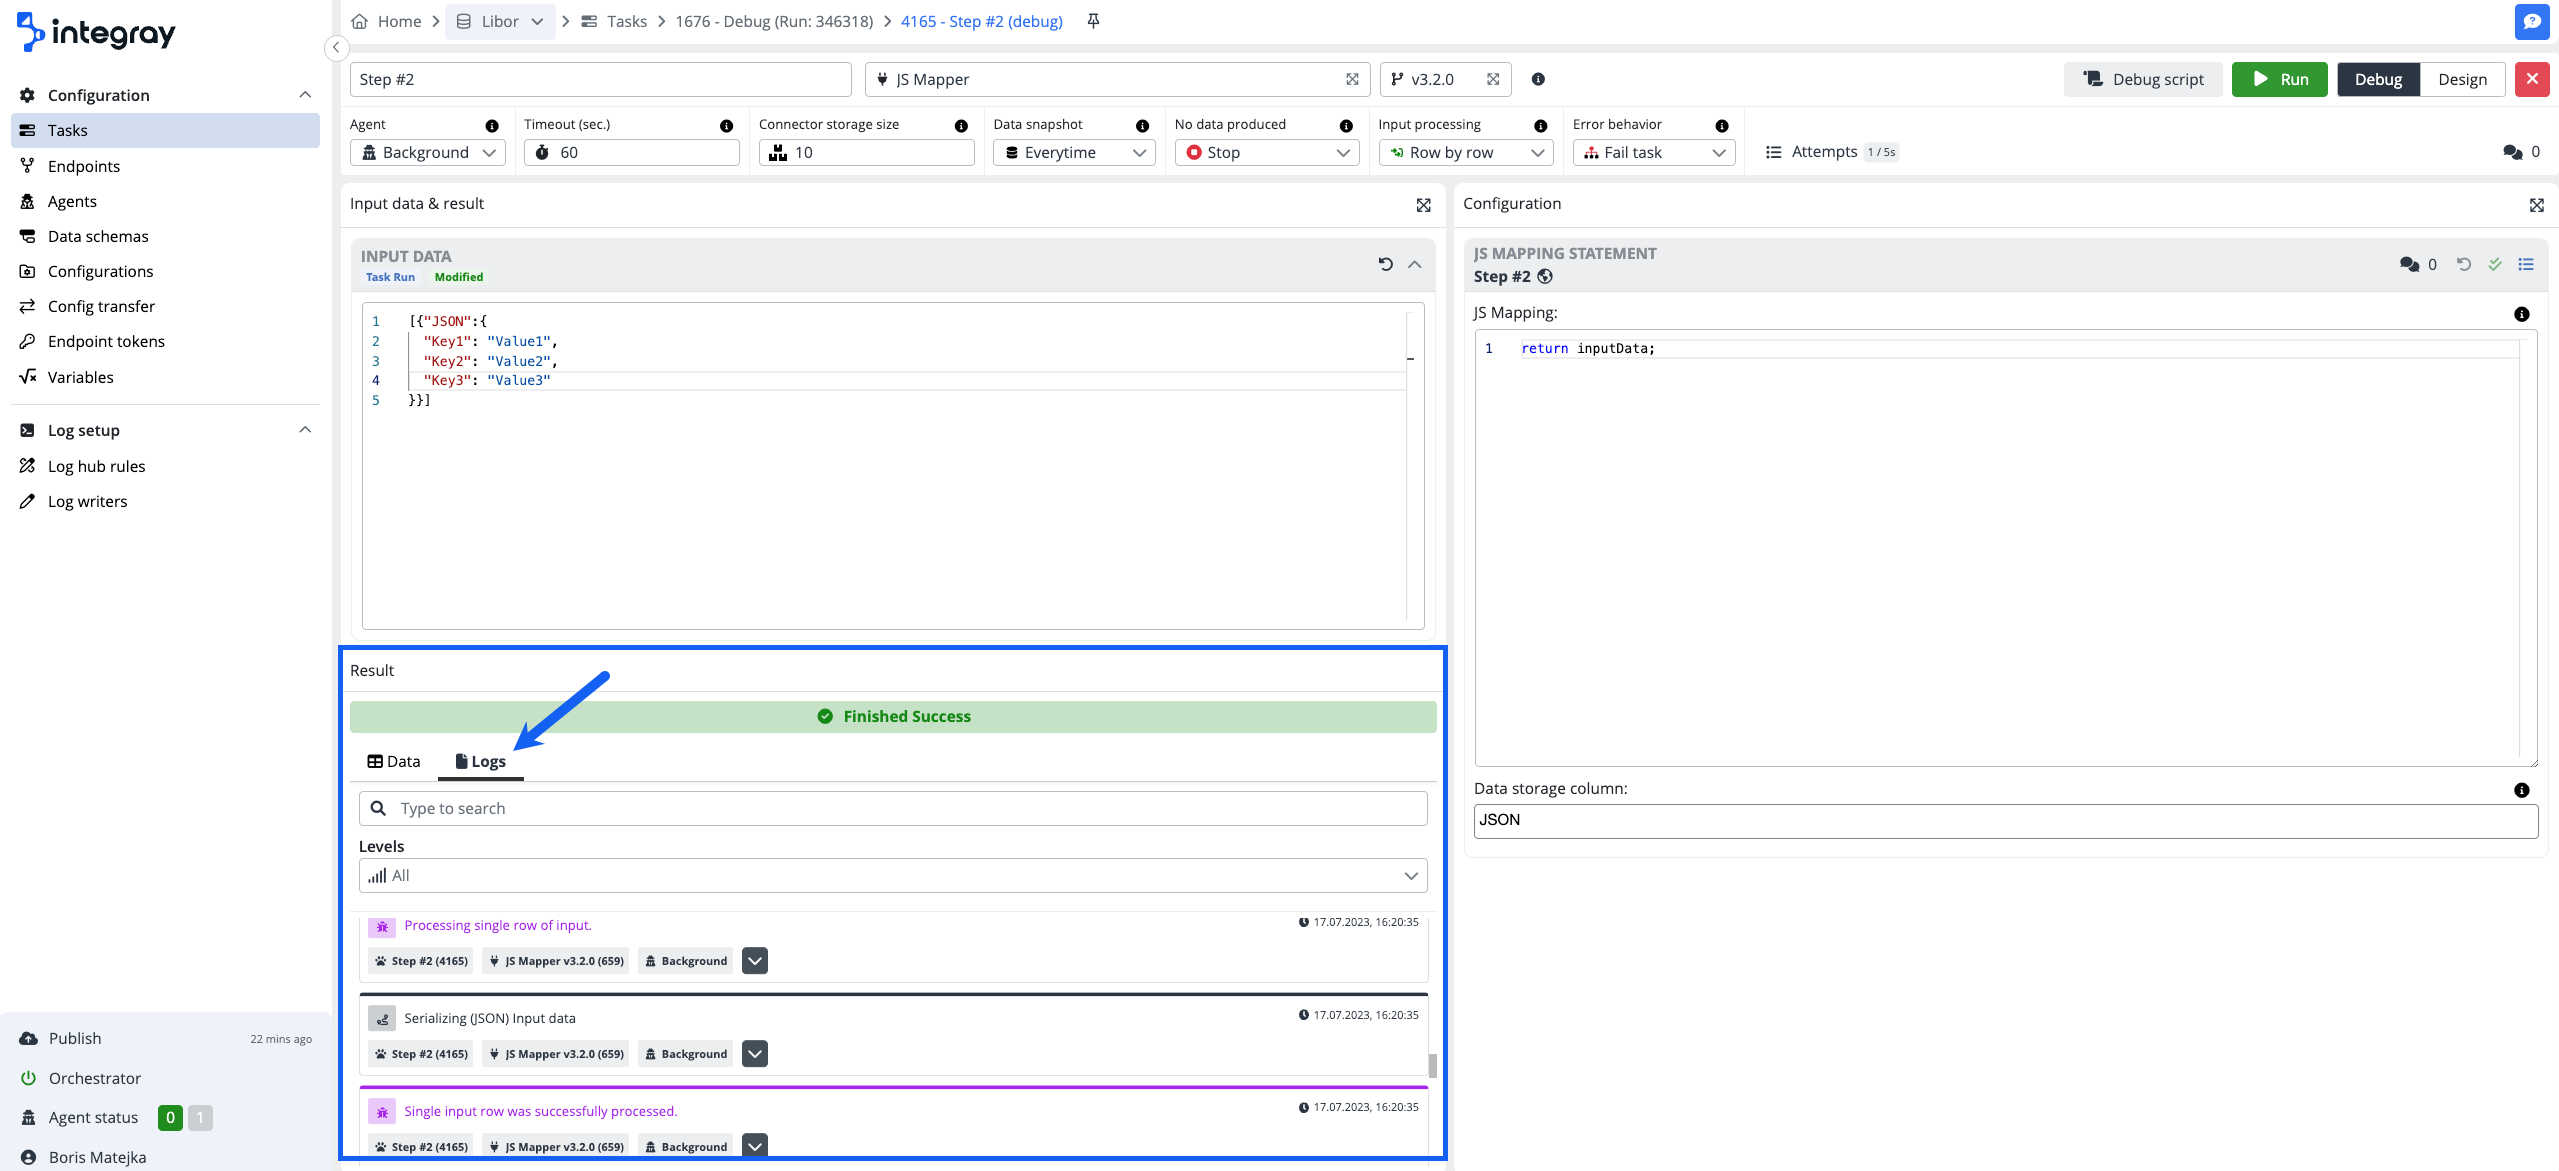
Debug run log
Similar to the task run log, nevertheless, no log hub rules apply here and all the levels are captured. You can use the full-text search as well as the log-level filters.
Configuration
The configuration is dependent on the connector used in the debugged task step. Usually, you will see the respective code editor.
The step configuration can be modified by the user and can also be reverted to the original task step configuration by clicking the rotate left icon in the top right corner of the configuration editor.
Debug from the task step editor
The debug mode from the task step editor facilitates your code tunning as follows:
-
No need for configuration saving and publishment.
-
It is not required to have input mapping.
-
When working in the task step design, the data are generated in JSON format, and content is generated according to the selected input schema.
-
Possibility to copy & paste input data.
Data are only temporarily saved on local storage in the browser.
Data are stored temporarily on the local storage in the browser. You may modify the generated input data. When you exit the debug mode and return, the modified input data will be still available.
You can enter the debug mode from the task step design view
Debug from the task run history
You can debug your code from the task run history view as well. This is mainly helpful in case the integration is already set up and during the integration task runs, tasks are failing and you need to investigate and fix the issue.
-
The task step data snapshot will be used as input.
-
You will see the data input in the JSON format.
You can modify input data to progress your tuning. The modification will not overwrite the task step run data snapshot. This allows you always to revert to the original task run data captured in the data snapshot for the task step.
You can enter the debug mode from the task run history view by clicking the bug icon located in the top right corner of the task step container.
Enable the data snapshot on the task step
You need to enable the data snapshot on the debugged task step. Make sure the data snapshot is set to "Everytime".
Debug script
The debug script functionality generates for you a full script that can be copied and used in any other tool, in case you would prefer external resources (tools) for your debug exercise.
Debug script availability
Debug script is available for a limited list of connectors: Microsoft SQL connector, Oracle connector, PostgreSQL connector, MySQL connector, SQLite connector, JS mapper, PowerShell, Node.js, and Python.
Debug script button is only available for the above-listed connectors in the debug mode from the Task run.
In the Help center > Connector academy, the debug script enabled connectors are marked by the note "Debug script enabled."
Debug script enabled.
